How to Measure AI Visibility for an Ecommerce Brand

By Daniel Peris




Table of contents
Most advice about measuring AI visibility was written for software companies. There the question is “best CRM for small teams”, the assistant lists five vendors, and every vendor named is also the place you buy. Mention rate is close enough.
Retail does not behave that way. Someone asks for the best running shoes for flat feet under 120 euros, and the answer might name three models, recommend a specialist retailer, return a shopping module with merchants and prices, or write four paragraphs about pronation with no product in sight. Your brand can be praised in the text while the purchase link goes to a marketplace listing sold by someone else. One number cannot tell those outcomes apart.
Three things ecommerce has to measure separately
Split the measurement into three questions. It is how we set reporting up for ecommerce teams.
The brand. Were you named at all, and in what order relative to other brands? This is the closest thing to the B2B metric, and it matters most on category questions where the assistant shortlists makers, not listings.
The product. Which SKU or model was named? A brand can have strong category visibility and weak product visibility: the assistant knows you make good hiking boots but recommends the model you discontinued two seasons ago. Product-level mentions are where merchandising problems surface.
The destination. Where does the answer send the buyer? Your own store, a retailer, a marketplace, a review site with affiliate links, or nowhere. Teams skip this, and it decides who takes the margin. “The Brooks Adrenaline is a good pick for flat feet, available on Amazon” is a win for the brand and a partial loss for its direct channel.
Keep those as three separate columns from the start. Retrofitting the split later means re-reading months of stored answers by hand.
What caught me off guard when we built shopping tracking was how often a brand wins the sentence and loses the card. The text calls your product the best pick, and the product card right next to it points to a reseller. If you only count mentions, you end up celebrating a result that sent the sale somewhere else.
 Esteve Castells Co-founder, LLM Pulse
What to track, with definitions
Six measurements cover most retail reporting. Every tool words them differently, so the definition matters more than the name.
| Metric | Definition | What it tells a retail team |
|---|---|---|
| Brand mention rate on category prompts | Share of answers to generic category and use-case questions naming your brand | Whether you make the shortlist before anyone types your name |
| Product-level mention rate | Share of answers to product or attribute questions naming one of your SKUs, per SKU | Which products the models know, and which they get wrong |
| Retailer and marketplace co-occurrence | Which sellers appear alongside or instead of you | Who captures the click when you are recommended |
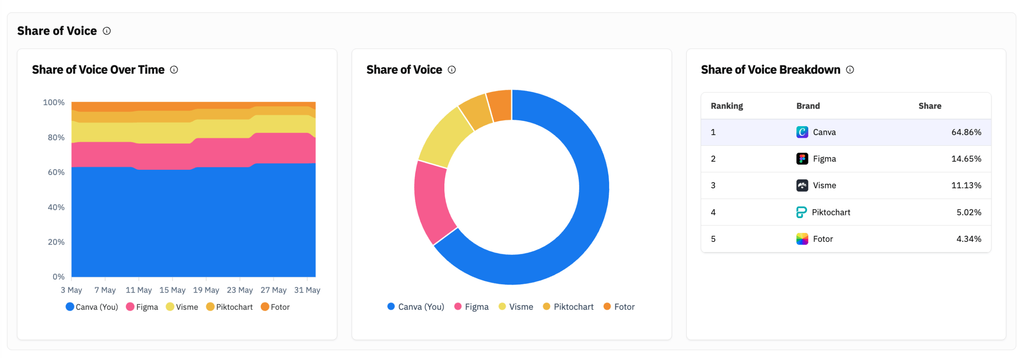
| Share of voice | Your share of all brand mentions in a defined prompt set and period | Position against rivals, if you run it twice |
| Sentiment | Whether the mention is positive, neutral or negative, and the reason given | Where review complaints leaked into how you are described |
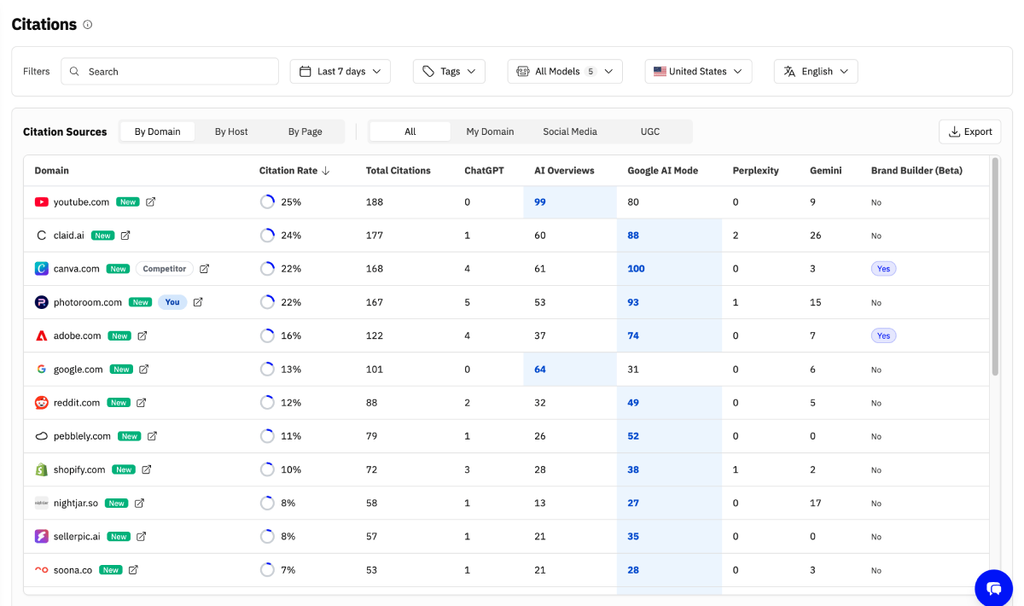
| Cited sources | Domains the answer links to or draws from: review sites, marketplaces, publishers, forums | Which pages to earn placement on next quarter |
Share of voice has to be run twice. Once against brand competitors, the other manufacturers of a comparable product. Once against retail intermediaries: the marketplaces, department stores and specialists in the same answers. A brand can hold 30% share against its manufacturer rivals while three marketplaces absorb most of the outbound links. One blended figure hides both problems. We covered the mechanics in how to measure AI share of voice.
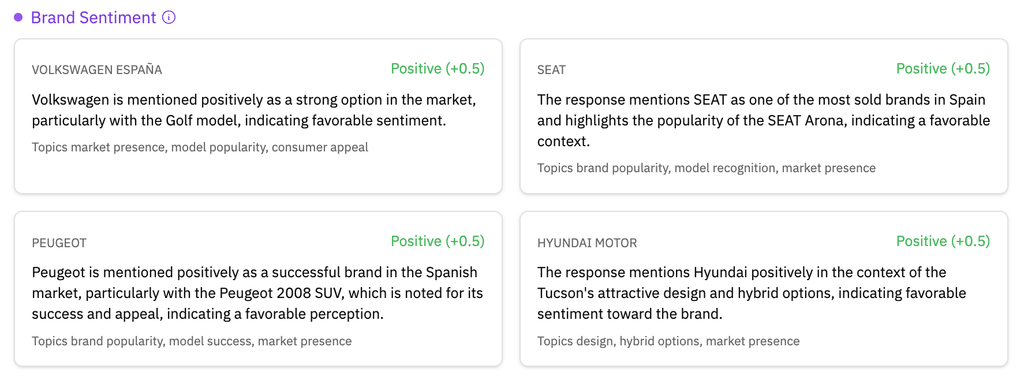
Sentiment leaks in from reviews. Assistants read review sites, Reddit threads and marketplace reviews, and that shows up as qualifiers: “durable but runs small”, “sizing is inconsistent”, “customer service complaints are common”. Those lines matter more than the mention itself, because they are the objection the buyer reads before clicking. Track the reason as well as the polarity; our glossary entry on brand sentiment in AI covers how the scoring works.
The source list deserves its own review cycle. If four review sites and two forums carry most of the citations in your category, that list is your outreach plan. Tracking which sources AI answers cite is the mechanical part.
Shopping surfaces change what visibility means
Assistants increasingly answer product questions with a structured module: products with images, prices and named merchants, sitting above or beside the prose. When it appears, what you are measuring is whether your product sits in the module and which merchant is attached to it. Three surfaces matter most for retail, and each works differently.
- ChatGPT shows product results with images, prices and merchants. In March 2026 OpenAI refocused its shopping experience on product discovery after pulling back from Instant Checkout, so the purchase now generally completes on the merchant’s own site.
- Google AI Mode draws on Google’s Shopping Graph, which Google said in May 2025 held more than 50 billion product listings, and shows products in a panel next to the conversation. Merchant Center feeds are the route in.
- Alexa for Shopping (formerly Amazon Rufus) is Amazon’s own assistant, renamed from Rufus on May 13, 2026. It recommends from Amazon’s catalogue, so the merchant is Amazon and the work sits in your Amazon listings.
So your product feed (titles, attributes, availability, pricing) decides whether you appear at all, and your merchant presence decides whether the buyer lands on you or a reseller. A feed problem and a visibility problem now look identical in the report.
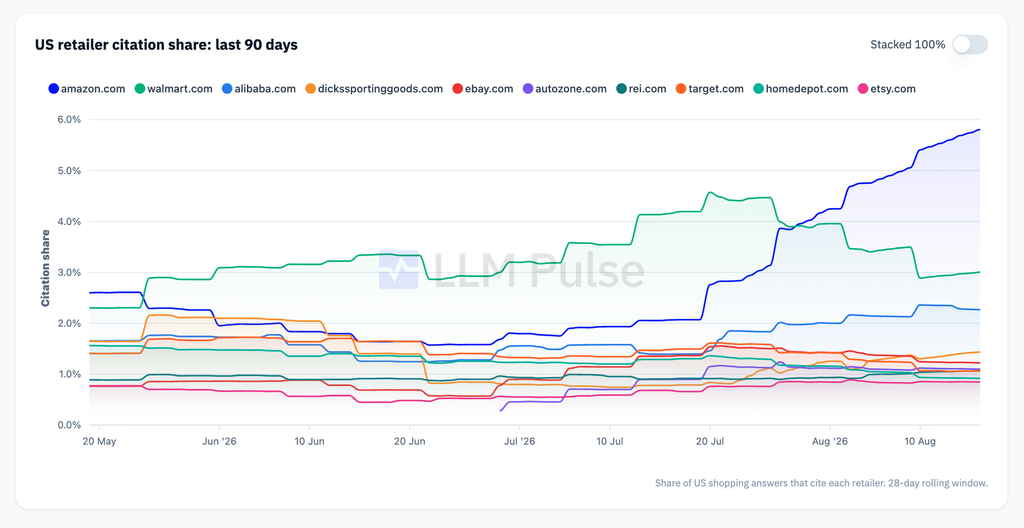
LLM Pulse tracks the product listings ChatGPT and Alexa for Shopping return for shopping-intent prompts in its Shopping report, so you can see which products come back for which questions, which merchants sit against them and at what price. Its ChatGPT Ads Library records sponsored placements observed inside ChatGPT answers. Read paid and organic together: a competitor buying into a question you win organically is worth noticing early.
Do your products show up when shoppers ask AI?
Track how AI answers name your brand and your products, and which merchants they send buyers to.
For assistants moving from recommending to transacting, see our post on agentic commerce. For which destinations actually receive the traffic, we analysed the pattern in where AI sends shoppers.
In ecommerce, being mentioned is nice, but what pays is where the click goes. If the answer recommends your product and the card next to it links to a marketplace, you did the hard part and someone else gets the sale. That’s why I tell retail teams to track the destination, not only the name.
 Daniel Peris Co-founder, LLM Pulse
Building the prompt set for retail
All of it depends on the prompt set, and a bad one gives you a clean chart of the wrong thing. Retail sets have five layers.
- Category prompts. “Best waterproof hiking boots”, “good espresso machines for a small kitchen”. These decide whether you exist at all.
- Use-case prompts. “Running shoes for flat feet”, “a coat for cycling to work in the rain”. This is where retail actually gets recommended, and most brands under-build it.
- Comparison prompts. Your brand or product against a named rival, which is the first page your executives will open.
- Price and budget prompts. “Under 120 euros”, “best value”, “cheapest reliable”. These often swap premium brands for private labels.
- Attribute long tail. Size, material, colour, compatibility, certification, gift occasion. Each one is tiny, and together they are most of the questions people ask.
Every layer has to exist per market and per language, because the answer differs by both. The same question asked in Spanish about the Spanish market surfaces different retailers, different price expectations and sometimes a different product. This is where retail sets get expensive: 80 prompts across four markets is 320, each running against every model you track. Prompt limits in LLM Pulse are counted per week and per model, and a weekly prompt produces roughly 4.33 scheduled answers per model per month, so 50 prompts across five models is already over a thousand answers a month. Decide the market split before the prompt count.
Seasonality is where most retail sets break. The instinct is to rebuild the set for Black Friday, then again for spring, at which point your year-on-year comparison is gone. Keep the core set stable and annotate instead: mark campaign windows, price changes and stock-outs on the timeline, so a drop in late November can be read against what you did that week. Seasonal prompts live in their own tagged group.
The attribution reality check
Whatever number your analytics reports for AI traffic, treat it as a floor.
GA4 has an AI Assistant default channel group, defined by Google as “the channel by which users arrive at your site from sources like ChatGPT, Gemini, Deepseek, Copilot, or Grok”, matched when the medium is exactly ai-assistant or the referrer is on Google’s list of AI assistants (Google’s channel definitions).
The same documentation defines Organic Search to include Google’s AI Overviews and AI Mode, and the AI Assistant channel explicitly excludes them. Clicks from Google’s AI features land in Organic Search, so the visibility you build there never shows in your AI channel. Search Console’s Generative AI performance report covers AI Overviews and AI Mode with impressions only: no clicks, no CTR and no position.
ChatGPT has added utm_source=chatgpt.com to links in its answers, which let GA4 attribute those visits even without a referrer. That is no longer dependable: since early October 2026 many links in ChatGPT answers arrive with neither the tag nor a referrer, which is why ChatGPT referral traffic fell by almost half in GA4 for many sites. Other assistants depend on the referrer, and referrers get stripped in plenty of ordinary situations, so some assistant-driven visits arrive looking like direct traffic.
Then there is demand you never see as a session: someone reads a recommendation, types your brand into Google an hour later, or walks into a store. Branded search volume and direct traffic are part of the picture, and neither can be cleanly attributed. Watch them as supporting lines, and do not build a conversion path out of them. AI visibility is a leading indicator you measure directly; AI traffic is a partial, understated lagging one.
A monthly shape that works for a retail team
Monthly is the right reporting cadence even when collection runs weekly, because retail answers move slowly outside campaign periods. A two-page report:
- Brand visibility on category and use-case prompts, trended, one line per market, never blended.
- Top and bottom products by product-level mention rate, movers called out.
- Destination mix: your store, a retailer, a marketplace, or nowhere.
- Share of voice, twice: against brand competitors and against retail intermediaries.
- Sentiment themes, quoted. Three real sentences beat any score.
- Source changes: domains that started or stopped being cited.
- Shopping and ads: products in modules, competitors running paid placements.
The findings turn into three kinds of work. Fix the product content and feed data, because wrong attributes, missing specifications and stale availability are the usual reason a model describes your product badly or skips it. Google’s guide to its generative AI features points merchants to Merchant Center feeds and says no special markup is needed, so most of the job is product page and feed hygiene.
Earn placement on the sources the answers cite. If the assistant keeps quoting two review sites and a forum thread, being reviewed there is worth more than another post on your own domain. Work from your measured citation list, not a generic PR list.
Treat marketplace presence as a visibility channel. If answers route buyers to a marketplace, your listing quality, review count and merchant status there are visibility work as much as sales work. That is uncomfortable for a direct-to-consumer team, but it is what the data says.
Frequently asked questions
Does AI drive real revenue for ecommerce yet?
For most catalogues the measurable traffic is small, and attribution is unreliable enough that even that number can be off in both directions. More product research now starts in an assistant, and assistants keep adding shopping features. You cannot start a trend line retroactively, so if you want to know in twelve months whether AI visibility moved revenue, you need the twelve months of data behind it.
Should we track our brand or our individual products?
Both, on separate prompt layers. Brand tracking tells you whether you are in the consideration set; product tracking tells you whether the right SKU gets recommended. Start with the brand and your 20 to 30 most important products.
How do we handle a catalogue too big to track product by product?
Sample it. Track the products carrying the revenue, the ones you are pushing this season and a control group of ordinary items, then track categories for the rest. Attribute prompts such as “waterproof walking boots wide fit” cover the long tail without one prompt per SKU.
What do we do when the answer recommends a marketplace instead of us?
First check whether your brand is still named in the text. If it is, the work is on why the assistant prefers the marketplace listing, which usually comes down to availability, price clarity and review volume. If it is not, you have a content and citation problem to fix first.
Can we measure this per market and language?
Yes, and you should, because the answers differ. Build the prompt set per market and language instead of translating one set, since local retailers, review sites and price expectations change which brands appear. LLM Pulse runs each prompt in its own country and language, so every market keeps its own numbers.
Is being in the shopping module the same as being visible?
No. Module presence depends on your product feed and merchant setup, while a recommendation in the prose depends on what the model has read about you. A brand can have one without the other, and different teams fix each.
Why does GA4 show so little AI traffic?
GA4's AI Assistant channel only counts visits whose medium is ai-assistant or whose referrer is on Google's list of AI assistants. Clicks from Google's AI Overviews and AI Mode count as Organic Search, and many assistant visits lose their referrer or tracking tag and show up as Direct. Read the AI channel as a minimum, not a total.






Discover your brand's visibility in AI search effortlessly
Daniel Peris
Daniel Peris is a serial entrepreneur and one of the Co-Founders of LLM Pulse. With a strong background in SEO and ASO, he has spent over 15 years building and scaling digital businesses. He brings extensive experience in SaaS, both in product and growth, focusing on refining the product and executing growth strategies.