Last updated: July 13, 2026
Every AI visibility tool on the market claims to report “share of voice”. The trouble is that no two tools agree on what that number actually means. One vendor counts how often your brand is named in the answer text. Another counts how often your domain is cited as a source. A third multiplies by position, so being mentioned first is worth more than being mentioned fifth. They all call it AI share of voice, and they all produce wildly different numbers for the same brand.
Table of Contents
If you have ever sat in a meeting where your agency says you have 38% AI SoV and your in-house tool says 12%, you have lived this problem. This guide fixes it. We will define AI share of voice properly, walk through the three formulas in current use, work a real example with 100 prompts and 5 competitors, then look at the traps that ruin most measurements: re-ask variance, prompt selection bias, model versions, and the closed-pool error. Read it once and you will be the most informed person in the room next time the SoV slide goes up.
What is AI Share of Voice?
AI share of voice is the percentage of AI-generated responses that mention, cite, or recommend your brand across a defined set of category prompts, relative to all brand mentions in those same responses. The “AI-generated responses” part is what separates it from classic SoV, which historically meant your brand’s share of paid media impressions, organic search rankings, or social mentions.
Classic SoV was easy to measure because the inputs were finite. A keyword either ranked or it did not. An ad either ran or it did not. AI search broke that. When a buyer asks ChatGPT “what is the best CRM for a 50-person SaaS company”, the answer is generated freshly each time, can list a different set of brands in a different order, and can change next week when the model updates. Share of voice in this world is no longer a static ranking. It is a probability distribution over brand mentions, sampled by running the same prompts across the same models on a recurring schedule.
The implications are uncomfortable. You cannot just check once and call it done. You need a fixed prompt set, repeated runs to average out probabilistic variance, the same denominator over time, and explicit handling of per-model and per-locale differences. This is exactly what platforms like LLM Pulse are built for, and it is why DIY spreadsheet tracking falls apart after the first month.
How AI SoV differs from classic SEO SoV
In classic SEO, share of voice was a function of keyword volumes and rank positions. A common formula was: for each tracked keyword, your weighted visibility (based on CTR for that rank) times that keyword’s search volume, divided by the total weighted visibility across all competitors for the same keyword set.
AI SoV has no rank position in the SERP sense. There is one answer, generated on the fly. Either your brand is named in that answer or it is not. Either your domain is cited as a source or it is not. The measurement collapses from “rank distribution across 10 results” to “presence vs absence in a single synthesised reply”, which is why the maths is simpler and the variance is higher.
Mention-based vs citation-based vs position-weighted SoV
Here is where most vendor confusion lives. AI SoV is reported in three fundamentally different ways, and each produces a different number for the same brand on the same data set. If you are evaluating tools or briefing a CMO, you need to know which one you are looking at.
1. Mention-based AI SoV
This is the most common formula. You count how often your brand is named anywhere in the AI answer text, then divide by the total brand mentions across all competitors in the same answers.
Formula:
Mention SoV = (Your brand mentions / Total brand mentions across all tracked brands) × 100
If across 100 prompts run weekly, ChatGPT names your brand 60 times and names all competitors (including you) 300 times, your mention SoV is 60 / 300 = 20%.
The benefit: it is intuitive and easy to explain. The cost: a single answer that lists 12 competitors counts as 12 mentions, which dilutes the metric in busy categories.
2. Citation-based AI SoV
Citation-based SoV does not count brand names in the prose. It counts how often your domain appears as a cited source link in the AI’s answer. This is sometimes called “citation share” because it measures URL inclusion, not brand recommendation.
Formula:
Citation SoV = (Citations of your domain / Total citations across all sources) × 100
If across the same 100 prompts Perplexity cites your domain 25 times and cites a total of 1,200 sources (including news, Wikipedia, Reddit, and competitor domains), your citation SoV is 25 / 1,200 = 2.1%.
This number looks much lower than mention SoV because the denominator includes every third-party publisher the model used. Citation SoV is what most matters on Perplexity, which includes numbered citations in the large majority of its responses. ChatGPT’s citation behaviour depends heavily on whether web search mode is active: with it enabled, citation rates are high; without it, named brands often appear without any external URL. This asymmetry is why citation-only measurement can understate visibility on ChatGPT while overstating the gap versus Perplexity. We cover this in citation sources analysis.
3. Position-weighted AI SoV
Position-weighted SoV rewards being named first. The intuition: when ChatGPT says “the top tools are HubSpot, Salesforce, and Pipedrive”, being HubSpot is worth more than being Pipedrive because users skim from the top.
The most common weighting is a harmonic decay: position 1 = 1.0, position 2 = 0.50, position 3 = 0.33, position 4 = 0.25, position 5 = 0.20, and so on, following 1/n.
Formula:
Weighted SoV = (Sum of your brand’s position weights / Sum of all brand position weights) × 100
Example: your brand is named first 10 times (weight 10.0), second 15 times (weight 7.5), and fifth 20 times (weight 4.0), for a total weighted score of 21.5. Competitors collectively score 60.0 across their positions. Your position-weighted SoV is 21.5 / 81.5 = 26.4%.
The catch: re-ask variance. When the same prompt is run twice, the brand order frequently changes. Because LLM outputs are sampled from probability distributions, the chance of two independent runs producing the exact same ordered brand list is very low, and published self-consistency research confirms that response variance is highest precisely on the competitive ranking questions marketers care most about. So while average position is meaningful over many runs, treating single-run position as ground truth is statistically reckless. Position-weighted SoV needs at least 3 to 5 repeats per prompt to stabilise.
Which one should you report?
Honest answer: track all three, then pick the one your stakeholders find most useful. For board reporting, mention-based SoV is the easiest to defend because the denominator is well-defined. For content strategy, citation-based SoV tells you which publishers and pages are pulling weight. For competitive positioning, position-weighted SoV captures the “who gets named first” question that everyone really cares about.
At LLM Pulse we surface all three by default. We call mention-based SoV “Brand Visibility” (visibility_score), and the position-weighted version “AI Visibility Score” (weighted_visibility_score). Citation-based metrics live alongside in the citations module. The naming is annoying but the maths is transparent.
Worked example: calculating SoV across 100 prompts and 5 competitors
Let us run a concrete example. You sell project management software. You define 100 prompts spanning category questions (“best project management tool for remote teams”), comparison questions (“Asana vs ClickUp for marketing teams”), and use-case questions (“project management software for product launches”). You track five brands: yours, Asana, ClickUp, Monday, and Notion. You run each prompt weekly across ChatGPT, Perplexity, Gemini, Google AI Mode, and Google AI Overviews. Each prompt fires once per model per week. For this example we collapse the 5 models into a single tally.
After one week of execution, the raw counts look like this:
| Brand | Total mentions | Mentions at position 1 | Mentions at position 2 | Mentions at positions 3-5 | Citations of brand domain |
|---|---|---|---|---|---|
| Your brand | 60 | 10 | 15 | 35 | 22 |
| Asana | 85 | 30 | 25 | 30 | 18 |
| ClickUp | 70 | 25 | 20 | 25 | 15 |
| Monday | 55 | 15 | 10 | 30 | 10 |
| Notion | 30 | 5 | 5 | 20 | 5 |
| Total | 300 | 85 | 75 | 140 | 70 |
Step 1: Mention-based SoV
Your mention SoV = (60 / 300) × 100 = 20%.
Asana = 28.3%, ClickUp = 23.3%, Monday = 18.3%, Notion = 10%. You are in third place by raw mentions, behind Asana and ClickUp.
Step 2: Position-weighted SoV
Apply 1/n weighting. Position 1 = 1.0, position 2 = 0.5, positions 3-5 we will average at 0.27 (the mean of 0.33, 0.25, 0.2).
Your weighted score = (10 × 1.0) + (15 × 0.5) + (35 × 0.27) = 10 + 7.5 + 9.45 = 26.95
Asana = (30 × 1.0) + (25 × 0.5) + (30 × 0.27) = 30 + 12.5 + 8.1 = 50.6
ClickUp = (25 × 1.0) + (20 × 0.5) + (25 × 0.27) = 25 + 10 + 6.75 = 41.75
Monday = (15 × 1.0) + (10 × 0.5) + (30 × 0.27) = 15 + 5 + 8.1 = 28.1
Notion = (5 × 1.0) + (5 × 0.5) + (20 × 0.27) = 5 + 2.5 + 5.4 = 12.9
Total weighted = 160.3
Your weighted SoV = (26.95 / 160.3) × 100 = 16.8%.
Asana = 31.6%, ClickUp = 26%, Monday = 17.5%, Notion = 8%. Notice you have slipped to fourth place once position is factored in, because most of your mentions came at positions 3 to 5, not 1 or 2. This is the kind of finding that changes content strategy: getting moved up two positions is more valuable than appearing twice as often at the bottom.
Step 3: Citation-based SoV
Citation SoV restricts to actual URLs cited. The same answer might mention “ClickUp” in prose but cite an independent review site rather than clickup.com.
Total brand-domain citations = 70. Your citation SoV = (22 / 70) × 100 = 31.4%.
Asana = 25.7%, ClickUp = 21.4%, Monday = 14.3%, Notion = 7.1%.
This time you are leading. Why? Because your team has invested in helpdesk articles, comparison pages, and SEO-optimised landing pages that the AI actually pulls from as evidence. Competitors get named more often by reputation, but you get cited more often as a source. Both are valuable signals; they tell different stories.
The takeaway from the worked example
The same data set produced three different SoV numbers for you: 20%, 16.8%, and 31.4%. Each is correct under its own definition. If a tool reports a single AI SoV figure without telling you which formula it used, you cannot reason about it. Always insist on the methodology.
Why your SoV differs across ChatGPT, Perplexity and Gemini
Even with one consistent formula, per-model SoV diverges sharply. The brand that wins ChatGPT often loses Perplexity, and Gemini frequently looks like a different category entirely. There are five concrete reasons.
1. Training data cut-offs differ. A model trained on data through October 2024 simply does not know about a product launched in February 2025. ChatGPT, Claude, and Gemini all sit at different freshness frontiers. If your brand grew quickly in 2025, older models under-represent you.
2. Retrieval behaviour differs. Perplexity and Google AI Mode are retrieval-heavy. They pull live web results, summarise them, and cite the sources. Your SoV here depends heavily on what ranks in their underlying index and what content exists about your brand on the open web. ChatGPT historically leaned more on training-data recall and named brands without external lookup, though Search mode has narrowed the gap. Gemini sits in between.
3. Citation policies differ. Perplexity cites external sources in the large majority of its responses and averages roughly 8 citations per answer. ChatGPT’s behaviour varies considerably depending on whether its web search mode is on: with it active the citation rate is high, without it brands are typically named from training-data recall rather than linked sources. This is why citation-based SoV is much more meaningful on Perplexity than on a default ChatGPT session, and why measuring both is non-negotiable.
4. System prompts and safety layers differ. Each model has its own preference for how to format “best of” answers, how many brands to list, whether to recommend at all, and how to caveat. Some models prefer 3 named options, others 5, others a paragraph without bullets. These structural defaults change the raw count of mentions per answer.
5. Source preferences differ. ChatGPT favours Wikipedia and structured publisher sites. Perplexity over-indexes on Reddit and YouTube. Gemini leans on Google’s own surfaces and editorial sites. A brand with a strong Reddit presence will look very different across these.
The operational consequence: report SoV per model, not aggregated. An aggregated AI SoV figure hides the real story. LLM Pulse defaults to per-model breakdowns and our Models Comparison view exists precisely to make these gaps obvious.
Per-locale SoV (and why global brands can’t ignore this)
Global brands routinely make a fatal error: they measure SoV in their headquarters language and assume it represents the world. It does not. AI models speak local languages, retrieve local content, and surface local competitors. A US tracking setup is blind to what happens in Spanish, German, French, Japanese, and Portuguese answers.
Three things change per locale.
The competitor set changes. A category that is “Stripe vs Adyen vs Checkout.com” in English becomes “Stripe vs Adyen vs Worldline” in French or “Stripe vs Adyen vs MultiSafepay” in Dutch. If you only measure your English competitor set, you do not see the local players who eat your share in-market.
The prompts change. Translation is not enough. “Best CRM for a small business” in Spain has different intent and shorthand than “mejor CRM para pequeñas empresas”. Locals search with idioms, abbreviations, and assumptions an English-only prompt set never captures.
The source ecosystem changes. Spanish Wikipedia, German trade press, French review sites, and Japanese app aggregators all factor differently into model outputs. A brand cited heavily in English-language press may be invisible in Iberian or LATAM AI answers because the relevant Spanish-language publications never wrote about you.
The fix: define a prompt set per locale, run it in the local language, with the local competitor set, and report SoV separately by country and language. We default to per-locale projects in LLM Pulse, and our global clients typically track 5 to 12 locales in parallel. A global aggregate is a useful summary, but it should never be the only number on the slide.
Common traps when measuring AI SoV
Most published SoV numbers are wrong in at least one of these five ways.
Trap 1: The closed-pool error
defined competitor set. LLM Pulse calculates Share of Voice from mentions of the tracked brand and configured competitors. Review the set periodically and add material emerging competitors so the comparison remains useful
Trap 2: Re-ask variance
Running each prompt once and treating the result as ground truth ignores that LLM outputs are probabilistic. The same prompt, asked twice five minutes apart, often produces different brand orderings, different brand sets, and occasionally different answers entirely. Best practice is 3 to 5 repeats per prompt per model per week, averaged. LLM Pulse runs all tracked prompts weekly and aggregates, with re-ask sampling on critical prompts.
Trap 3: Prompt selection bias
Building your prompt set from the keywords you already rank for is the most common mistake. Your existing keyword set reflects historical search behaviour, not where AI answers your category. Build prompts from sales call transcripts, support tickets, Reddit, and customer interviews. Aim for 100 to 200 prompts initially, balanced across category, comparison, and use-case intents. Our prompt research tool surfaces actual buyer language you would otherwise miss.
Trap 4: Model version drift
“GPT-4” in March is not “GPT-4” in October. Models update, system prompts shift, RLHF tuning evolves. A 10-point SoV drop in three months may be a real loss, or it may be that the model started recommending fewer brands per answer. Always record the model version (or label, when version numbers are hidden) alongside the SoV figure. When OpenAI or Google ship a major update, expect a discontinuity and annotate your dashboards.
Trap 5: Single-run position weighting
Position weighting is useful as an aggregated signal, but applying it to single runs is statistically unstable. LLM outputs are sampled from probability distributions, so two independent runs of the same prompt will rarely produce the same brand ordering. Self-consistency research consistently shows response variance is highest on competitive ranking questions. Always average position weights across at least 3 repeats before reporting them.
Trap 6: Sentiment blindness
A mention is not always a win. If ChatGPT names your brand 60 times across 100 prompts but 40 of those mentions are framed as “expensive and complicated”, you have a brand visibility problem dressed up as a brand visibility win. AI SoV without sentiment is incomplete. Pair every SoV metric with sentiment context via brand sentiment analysis.
How to set a meaningful SoV baseline and target
Once you can measure SoV correctly, the next question is: what number is good? There is no universal answer, but there is a sensible framework.
Step 1: Measure for at least 4 weeks before setting a baseline. Single-week SoV is noisy. Four weeks of weekly runs gives you the variance band as well as the central tendency. Note the high, the low, and the average per model per locale.
Step 2: Benchmark against the category, not against an absolute number. A 20% mention SoV is poor if you are the largest player in a 4-competitor category, and exceptional if you are number 7 of 15.
Step 3: Use these rough bands as starting context.
| Position in category | Realistic mention SoV target | Weighted SoV target |
|---|---|---|
| Category leader | 40-70% | 35-60% |
| Top 3 challenger | 20-35% | 15-30% |
| Top 10 player | 10-20% | 7-15% |
| New entrant | 2-10% | 1-7% |
Step 4: Set targets per model and per locale, not just globally. Your team should know it is realistic to lead on ChatGPT in the US while still being a top-3 challenger on Perplexity in Germany. Aggregate goals hide where you are actually winning and losing.
Step 5: Re-baseline quarterly. Categories evolve, competitors launch, models update. A baseline set in January 2026 will be partially stale by July. Refresh it.
Tools that measure AI SoV correctly
The market for AI SoV tracking has matured fast since 2024. Most tools now report some form of SoV; the question is whether they do it correctly and transparently. Here is an honest sweep of the credible options as of mid-2026.
1. LLM Pulse
LLM Pulse is built specifically for AI visibility analytics. It reports all three forms of SoV: mention-based (“Brand Visibility”), position-weighted (“AI Visibility Score”), and citation-based (via the citations module). Every prompt runs weekly across ChatGPT, Perplexity, Gemini, Google AI Mode, and Google AI Overviews on every plan (no expensive upsell for “more models”). Enterprise can optionally add Claude, Copilot, Grok, DeepSeek, and Meta AI as paid add-ons. Per-locale and per-model breakdowns are first-class, the open-denominator competitor set is default behaviour, and re-ask sampling is supported on critical prompts. Pricing starts at €49/month for 50 prompts, which works out to about €0.98 per prompt, or roughly 1,000 AI evaluations per month for the entry plan. The Looker Studio integration with a ready-made template makes CMO reporting trivial. White-label is available for agencies.
2. Semrush AI Visibility Toolkit
Semrush rolled AI SoV into its Brand Performance suite. It reports mention frequency, position, and competitive context, and on ChatGPT specifically it also factors in topic search volume. Standalone pricing is around $99/month per domain, or part of the Semrush One bundle starting around $199/month. Strengths: deep keyword and competitive heritage feeding the prompt construction. Weak point: the methodology behind the composite score is not fully transparent, and per-locale support depends on which AI engines are tracked in that locale.
3. HubSpot AEO
HubSpot launched AEO in 2025 and rolled it out fully in the 2026 spring spotlight. It tracks brand visibility scores, share of voice, and citations across ChatGPT, Gemini, and Perplexity. Included with Marketing Hub Pro and Enterprise; standalone at around $50/month. Free AEO Grader available for one-off audits. Strengths: tight integration into HubSpot workflows for HubSpot customers. Limitation: prompt cap and model coverage thinner than dedicated AI visibility tools.
4. Profound
Profound (note: this is the AI visibility platform, not the unrelated company at profound.com) is positioned at the enterprise end. Strong on coverage and analyst-friendly dashboards. Starter is $99/month for ChatGPT, Growth is $399/month for three engines, and Enterprise pricing is custom. Best fit when you have a large internal data team and want extensive APIs.
5. Peec AI
Peec AI focuses on the mid-market with simpler UI. Starts at $95/month. Good for teams that want a single visibility view without configuring multi-formula reporting.
6. Scrunch
Scrunch combines tracking with prescriptive recommendations. Core starts at $250/month for 125 prompts, five seats, and four LLMs; a 7-day trial is available. Strong on technical diagnosis (why a citation is missing) as well as monitoring.
The honest framing: most credible tools will give you a defensible mention-based SoV. The differentiation is in per-model and per-locale depth, transparency of the formula, integration with reporting tools like Looker Studio, and price. If you are an agency managing multiple clients, the white-label and unlimited-seats angle matters a lot, which is one reason LLM Pulse leans hard into the agency segment.
How to report AI SoV to your CMO (template)
A CMO does not want six tabs of raw counts. They want one slide that answers three questions: how are we doing, how is that changing, and what should we do about it. Here is a reporting template that has worked across the LLM Pulse client base.
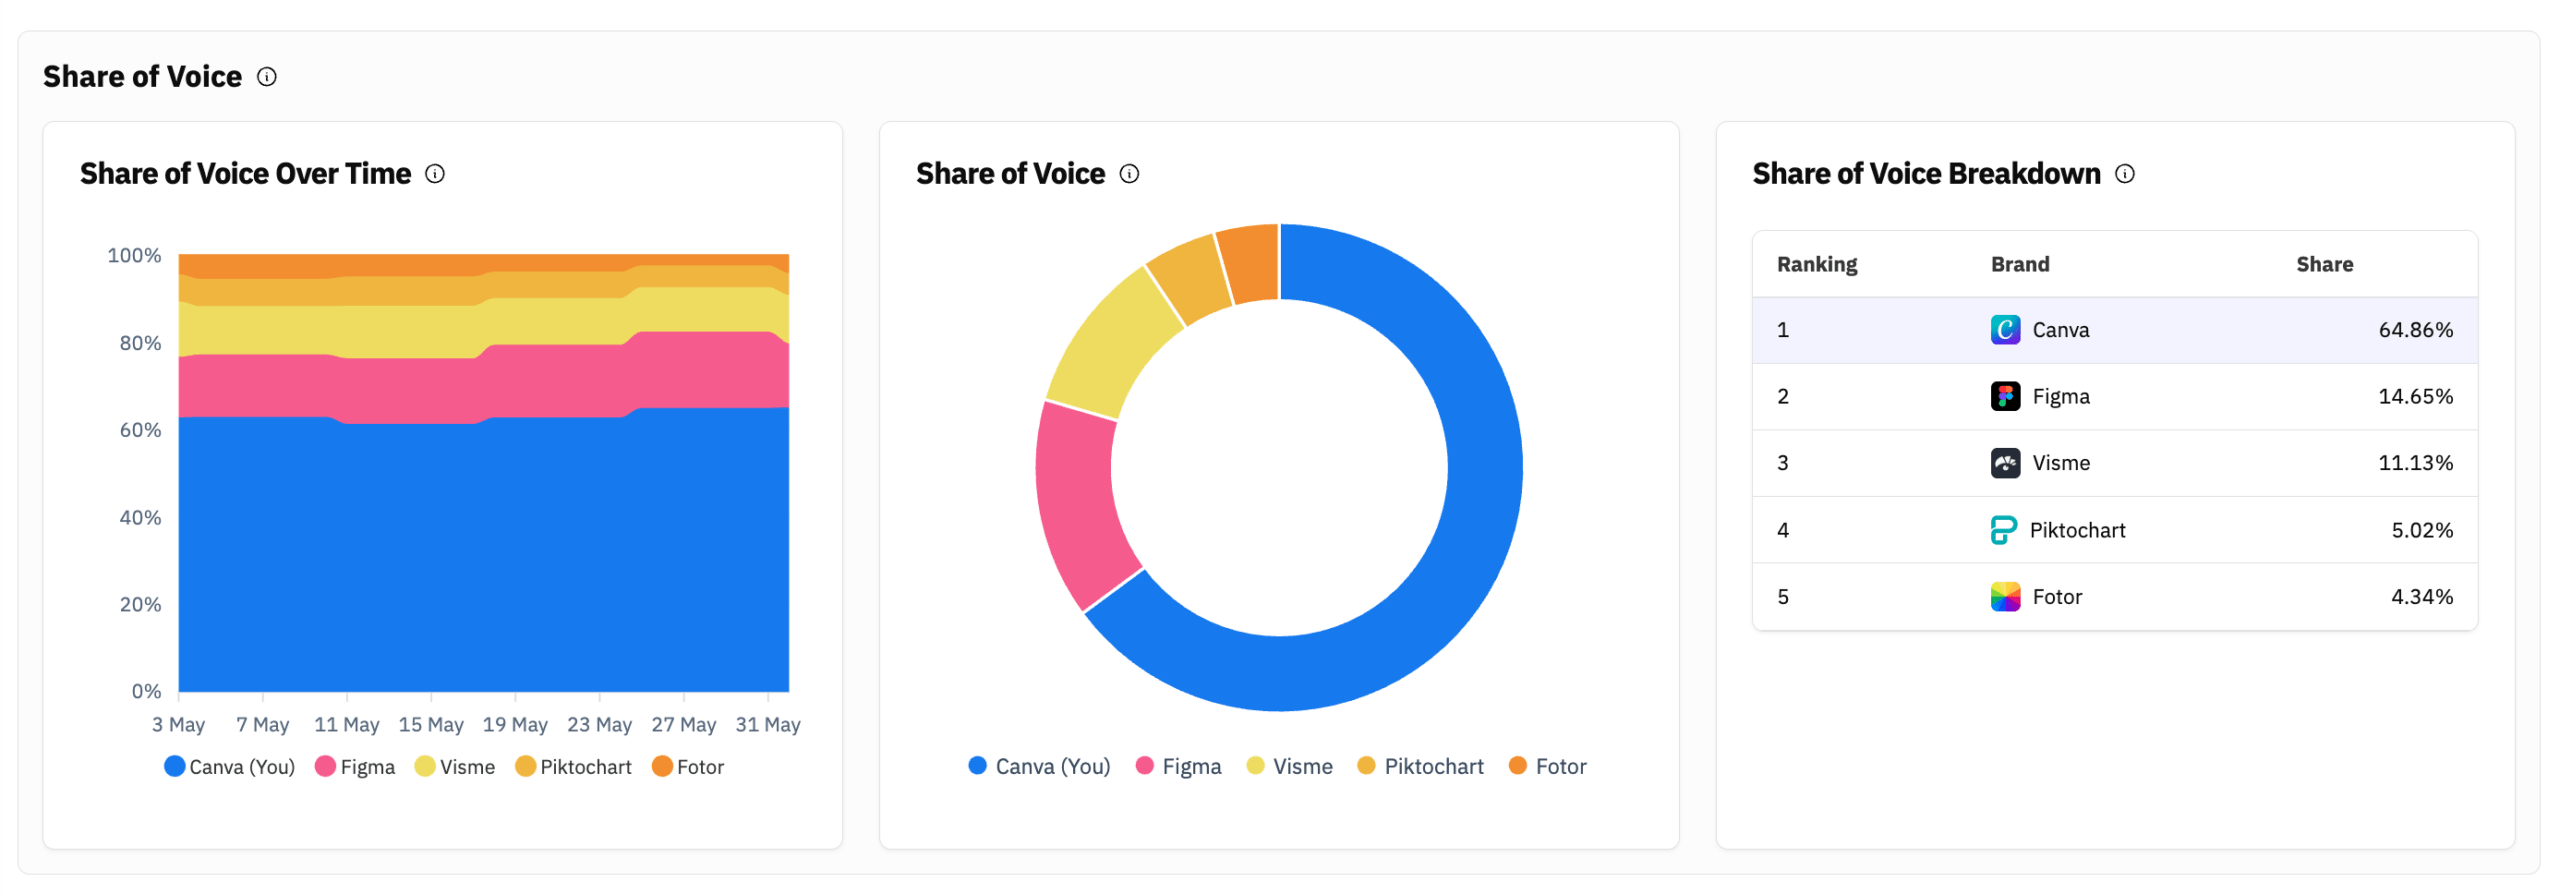
Slide 1: Headline SoV
One number, one comparison. Example: “AI Share of Voice (mention-based): 22.4% (Q4 2026), up from 18.1% in Q3 2026.” Note the formula explicitly. Show the trend line below.
Slide 2: Per-model breakdown
A small table or bar chart showing SoV on ChatGPT, Perplexity, Gemini, Google AI Mode, and Google AI Overviews. Highlight where you are above and below the average. This is where the “we lead ChatGPT but trail Perplexity” insight lives.
Slide 3: Per-locale (only for global brands)
SoV by country or language, side by side. Flag the locales where your global brand is invisible. This is usually the slide that triggers a content investment decision.
Slide 4: Competitive landscape
A horizontal bar chart of your top 5 competitors’ SoV. Annotate movements: “Asana up 4 points, ClickUp down 2 points”. Pair with a single competitor mention you want to call out specifically.
Slide 5: Sentiment context
Of your tracked mentions, what percentage are positive, neutral, or negative? A SoV slide without sentiment can mislead the CMO into thinking volume = win. Pair them.
Slide 6: One recommendation
“In Q1 2026 we will invest in three comparison pages targeting use-case prompts where Perplexity over-indexes on Reddit, where we lost 6 points last quarter.” Concrete, actionable, single-quarter scope.
If you build this in Looker Studio using our ready-made template, the entire stack updates automatically and the CMO meeting becomes a 10-minute conversation about decisions rather than a 45-minute interrogation of numbers.
Summary
AI share of voice is the single most important leading indicator of AI-driven brand growth, and almost everyone measures it wrong. The fixes are concrete: pick one formula and name it; open the denominator so emerging rivals appear; run prompts repeatedly to absorb re-ask variance; break the metric out per model and per locale; pair it with sentiment; and report it in a structured CMO-ready template rather than as a single context-free percentage.
If you do all of that, you will spend less time arguing about whose number is right and more time deciding which content investments and PR plays move the metric. That is the goal. Start a 14-day trial of LLM Pulse and you can see your real SoV across 5 models within an hour of setup.
FAQ
How often should I measure AI share of voice?
Weekly is the right cadence for most brands. AI answers change frequently, with citation drift in the 40 to 60% range month over month in active categories. Weekly runs catch shifts early without being too noisy. For B2B brands in slower-moving categories, bi-weekly is acceptable. Monthly is the absolute floor; anything less frequent and you will miss model updates and competitor moves.
How many prompts do I need to track for reliable AI SoV?
A minimum of 50 prompts gives you a defensible measurement; 100 to 200 is the sweet spot for most categories. Below 50, single-prompt variance dominates and the metric is too noisy. Above 200, marginal information per prompt drops sharply. Allocate prompts across category questions, comparison questions, and use-case questions in roughly equal thirds.
Should I track all AI models or just ChatGPT?
All of them. ChatGPT has the largest user base but per-model variance is the rule, not the exception. A brand that wins ChatGPT can be invisible on Perplexity, which is heavily used by researchers and analysts, or on Gemini, which is integrated across Google’s surfaces. Every plan on LLM Pulse runs across 5 models by default (ChatGPT, Perplexity, Gemini, Google AI Mode, Google AI Overviews) precisely because per-model tracking is non-negotiable.
What is the difference between AI share of voice and AI visibility?
AI visibility (or mention rate, or brand visibility) is the percentage of your tracked prompts that mention your brand at all. It is an absolute number: “you appear in 22% of answers”. AI share of voice is a relative number: “of all brand mentions across all answers, 18% are yours”. Visibility tells you how often you are present; SoV tells you how often you are present compared to everyone else. Both matter, neither replaces the other.
Can I calculate AI SoV myself in a spreadsheet?
For one month, yes. You can manually run prompts in ChatGPT, log mentions, and divide. After 4 weeks you will realise the problems: re-ask variance you cannot capture, per-locale prompts you do not have time to translate, model versions you cannot pin, and citation tracking that requires parsing source URLs. The DIY phase ends fast. The reason platforms like LLM Pulse exist is that automating the run, the parsing, the aggregation, the per-model and per-locale segmentation, and the dashboard reporting is the hard part. The formulas themselves are simple maths.
Why does the same tool sometimes report different SoV numbers in different weeks?
Because the inputs change every week. Models update, system prompts shift, your competitors launch new products, the underlying training and retrieval data drifts. A 5-point swing week to week is usually noise; a 5-point swing held for 3 to 4 weeks is a real change. Track the trend, not the absolute single-week reading. Annotate model release dates on your dashboards so you can distinguish “the model changed” from “we lost share”.
Does AI SoV correlate with revenue?
Increasingly, yes. With AI-driven referral traffic and brand awareness rising sharply through 2025 and 2026, AI SoV is becoming a leading indicator of pipeline and conversion. The strongest signal comes when you triangulate AI SoV with web analytics traffic from AI sources (via the GA4 and Plausible integration) and with conversion data from your CRM. A rising AI SoV without a rising AI-sourced traffic line means the SoV is up but not yet converting; rising both is a clean signal.