How are Sentiment and Net Sentiment Scores calculated?
LLM Pulse analyzes sentiment at the response level first, then aggregates it to give you meaningful insights across your entire project.
Step 1: Response-level analysis
Each detected mention is queued for sentiment analysis. The analyzer evaluates the response using the brand's main name and its configured matching names. This applies to your brand and tracked competitors.
| Category | Score |
|---|---|
| Very Positive | +1.0 |
| Positive | +0.5 |
| Neutral | 0 |
| Negative | -0.5 |
| Very Negative | -1.0 |
This analysis is performed by an AI model that evaluates the context, tone, and language used when discussing your brand or competitor.
For your own brand, you can add up to 5 custom rules under Preferences > Project Settings > Sentiment Rules. Each rule can contain up to 200 characters. A rule can tell the analyzer that a normally neutral or positive association should count as negative for your brand. These rules override the general category guidance when relevant, but they do not change mention detection, the five sentiment categories, or competitor analysis. They apply to new and re-run analysis, not existing results.
Only classified mentions are included in sentiment percentages and Net Sentiment Score. A mention can remain unclassified while processing or when no sentiment result is available. It still counts as a Mention and appears in sentiment coverage.
Step 2: Aggregated metrics
Once we have sentiment data for individual responses, we aggregate it to show you the bigger picture:
Share of Sentiment
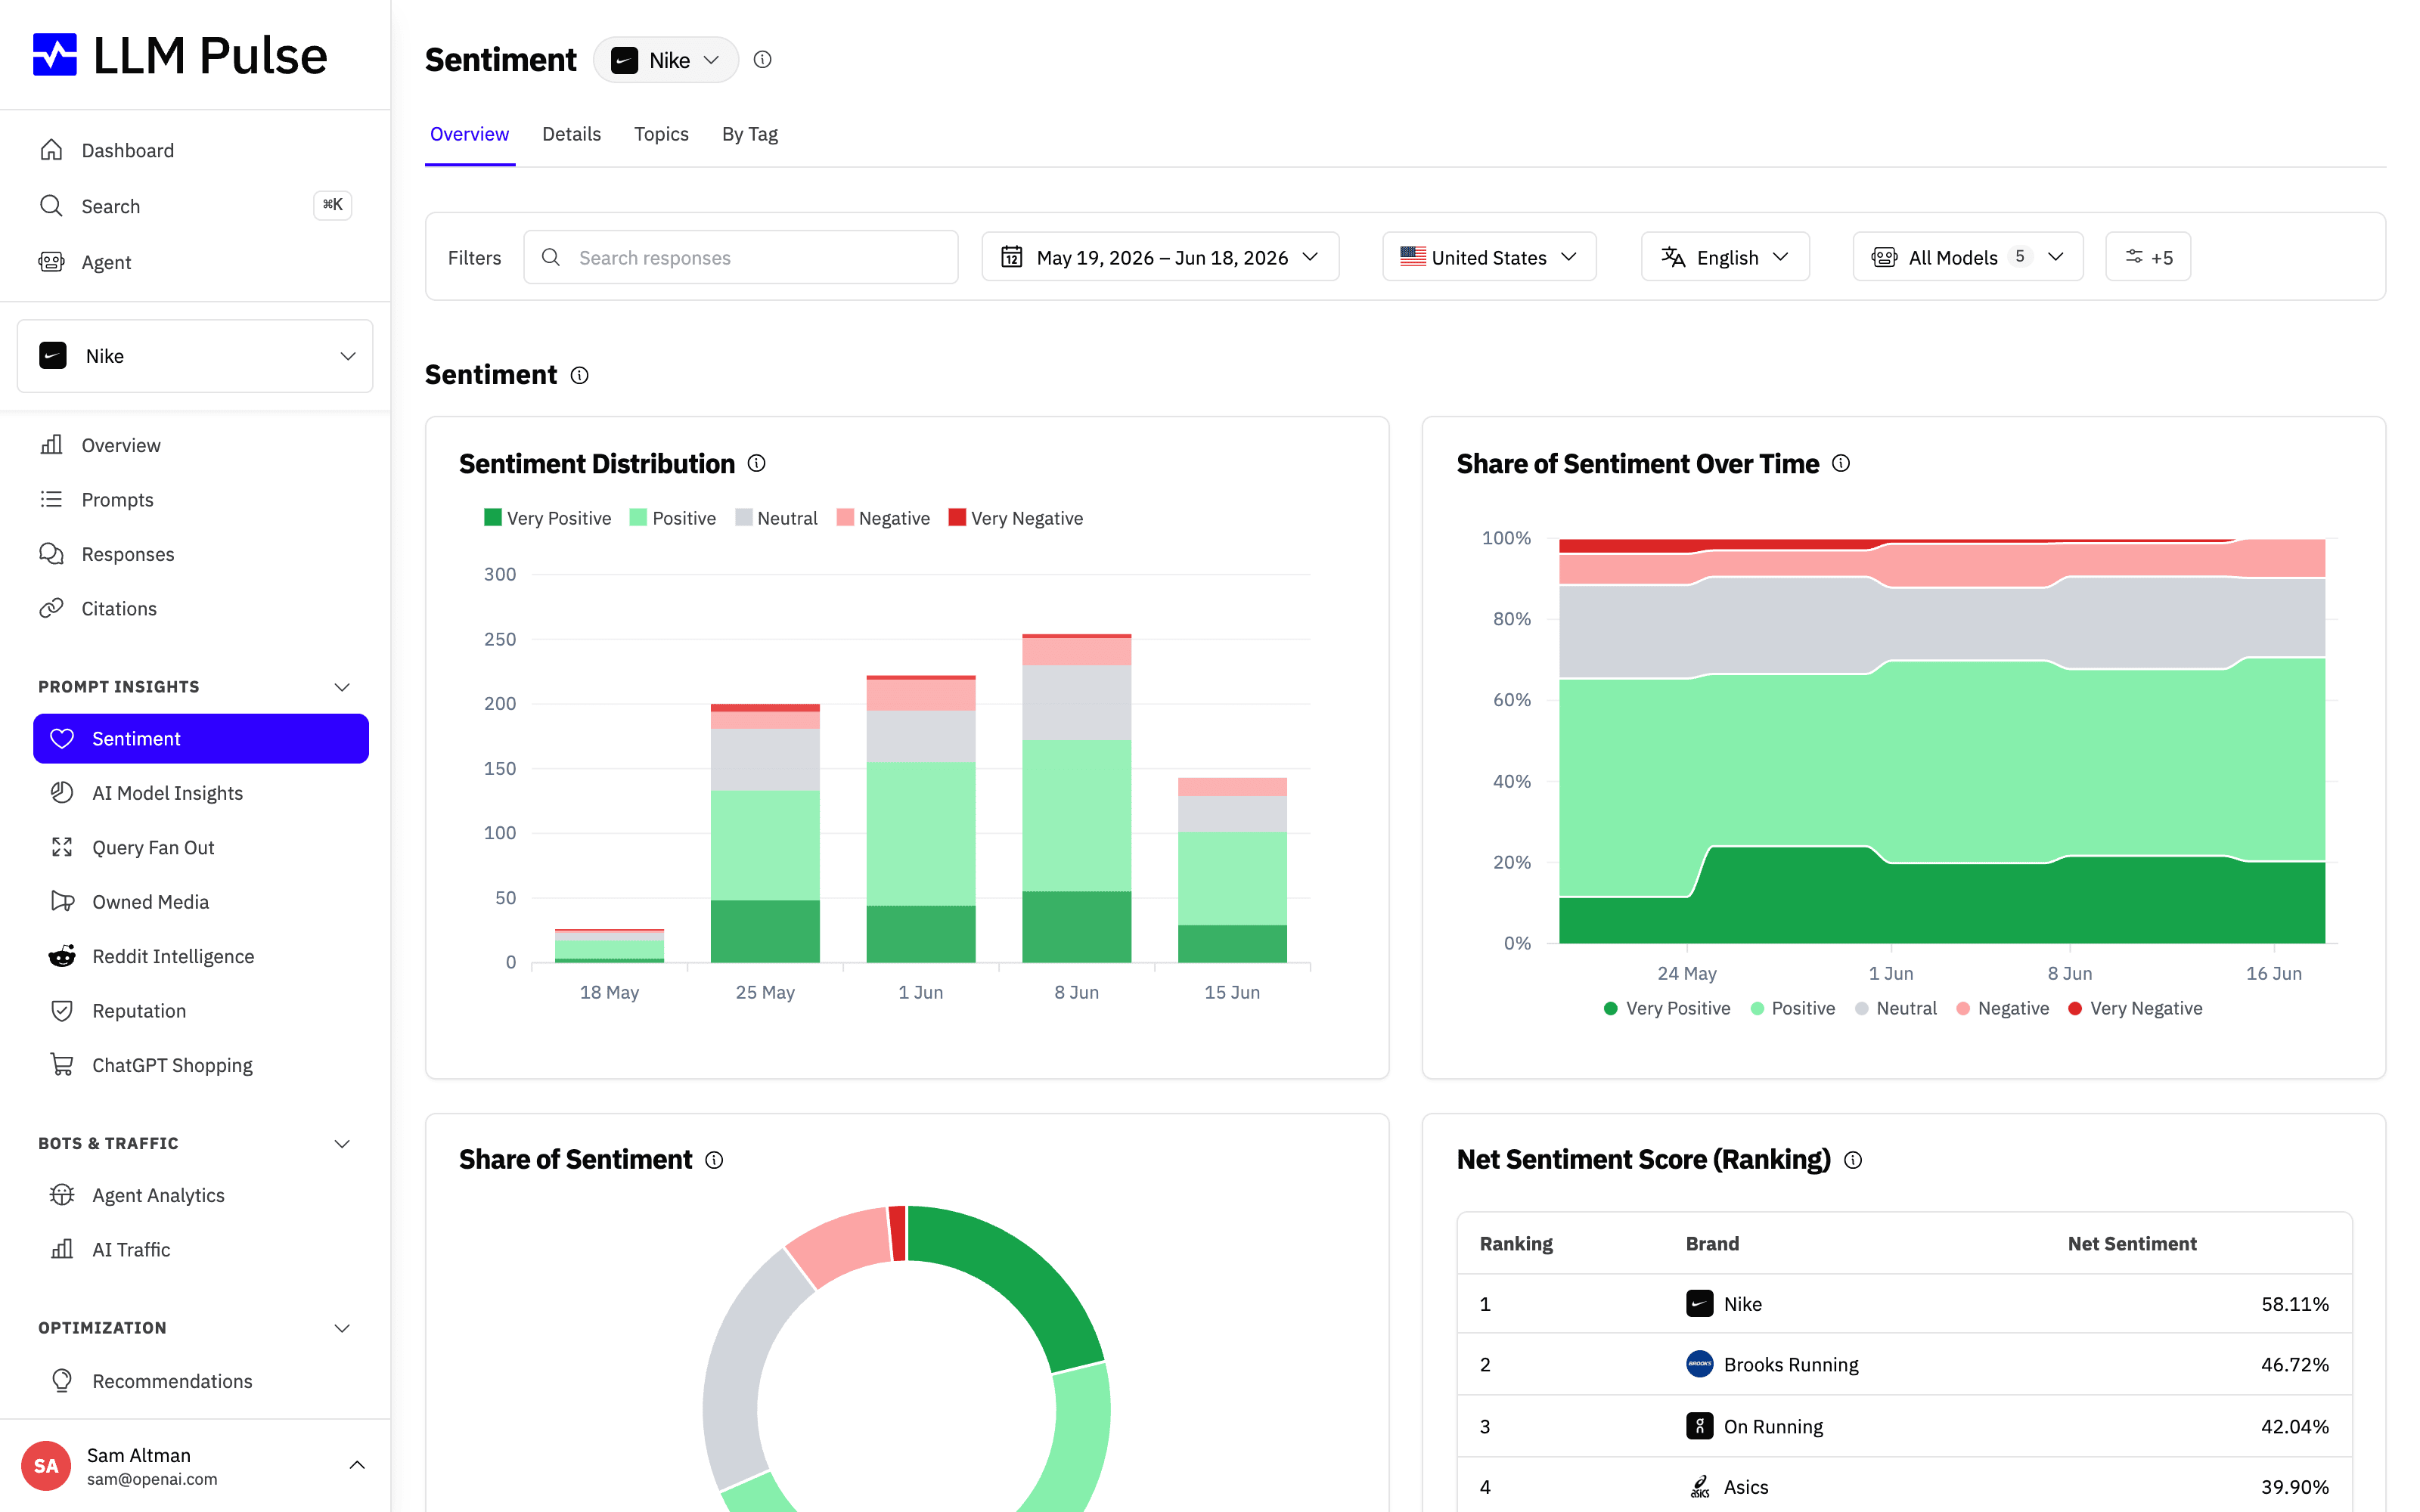
A breakdown showing what percentage of classified mentions falls into each sentiment category (displayed as a pie/donut chart and over-time area chart).
Net Sentiment Score
A single number that tells you the overall sentiment health of your brand.
Formula:
The values above label the sentiment category assigned to an individual response. Net Sentiment Score uses category counts, not those numeric values as weights: each classified mention counts once.
Net Sentiment Score = ((Positive mentions + Very Positive mentions) − (Negative mentions + Very Negative mentions)) / Classified Mentions × 100
Score Range: -100% to +100%
- +100% = All mentions are positive or very positive
- 0% = Balanced sentiment (equal positive and negative)
- -100% = All mentions are negative or very negative
The sentiment dashboard brings these pieces together in one place. You can see the sentiment distribution, the share of sentiment over time, a sentiment donut, and a Net Sentiment Score ranking that compares your brand against competitors.
Example calculation
Let's say your brand received 100 mentions this month and all 100 received a sentiment classification:
- Very Positive: 20
- Positive: 35
- Neutral: 25
- Negative: 15
- Very Negative: 5
Net Sentiment Score:
= ((35 + 20) − (15 + 5)) / 100 × 100
= (55 − 20) / 100 × 100
= 35%
Your Net Sentiment Score would be +35% , indicating a healthy positive sentiment overall.
If 97 of 100 detected mentions were classified, the dashboard would show "97 of 100 mentions classified" and use 97 as the denominator.
How we use it
- Sentiment Over Time: Track how sentiment evolves day-by-day, week-by-week, or month-by-month
- Competitor Comparison: See how your Net Sentiment Score ranks against competitors in the same AI conversations
- Filter the results: Choose one or more countries, languages, sentiment categories, or tags, then use topics and AI models for more context. Values inside one filter are combined with OR, while different filters are combined with AND.
Key takeaways
- Response-level first: Detected mentions are queued for sentiment analysis
- Then aggregated: Each classified mention contributes one count to the category totals used in your dashboard metrics
- Net Sentiment: A quick health check ranging from -100% (all negative) to +100% (all positive)
- Actionable: Use filters to identify which topics or AI models show the most (or least) favorable sentiment toward your brand