The Overview dashboard: your AI visibility over time
The Overview is the main analytics page for each project. It shows your brand's AI visibility trends over time with interactive charts and key performance indicators.
With the Overview, you can:
- See at a glance how often ChatGPT, Perplexity, Gemini, and Google AI mention your brand
- Track your Mention Rate and AI Visibility Score week over week to know if your GEO work is paying off
- Compare your visibility head to head against tracked competitors on the same charts
- Read your Average Mention Position to see whether AI names you first or last among competitors
- Export a branded PDF of the dashboard to share with your team or clients
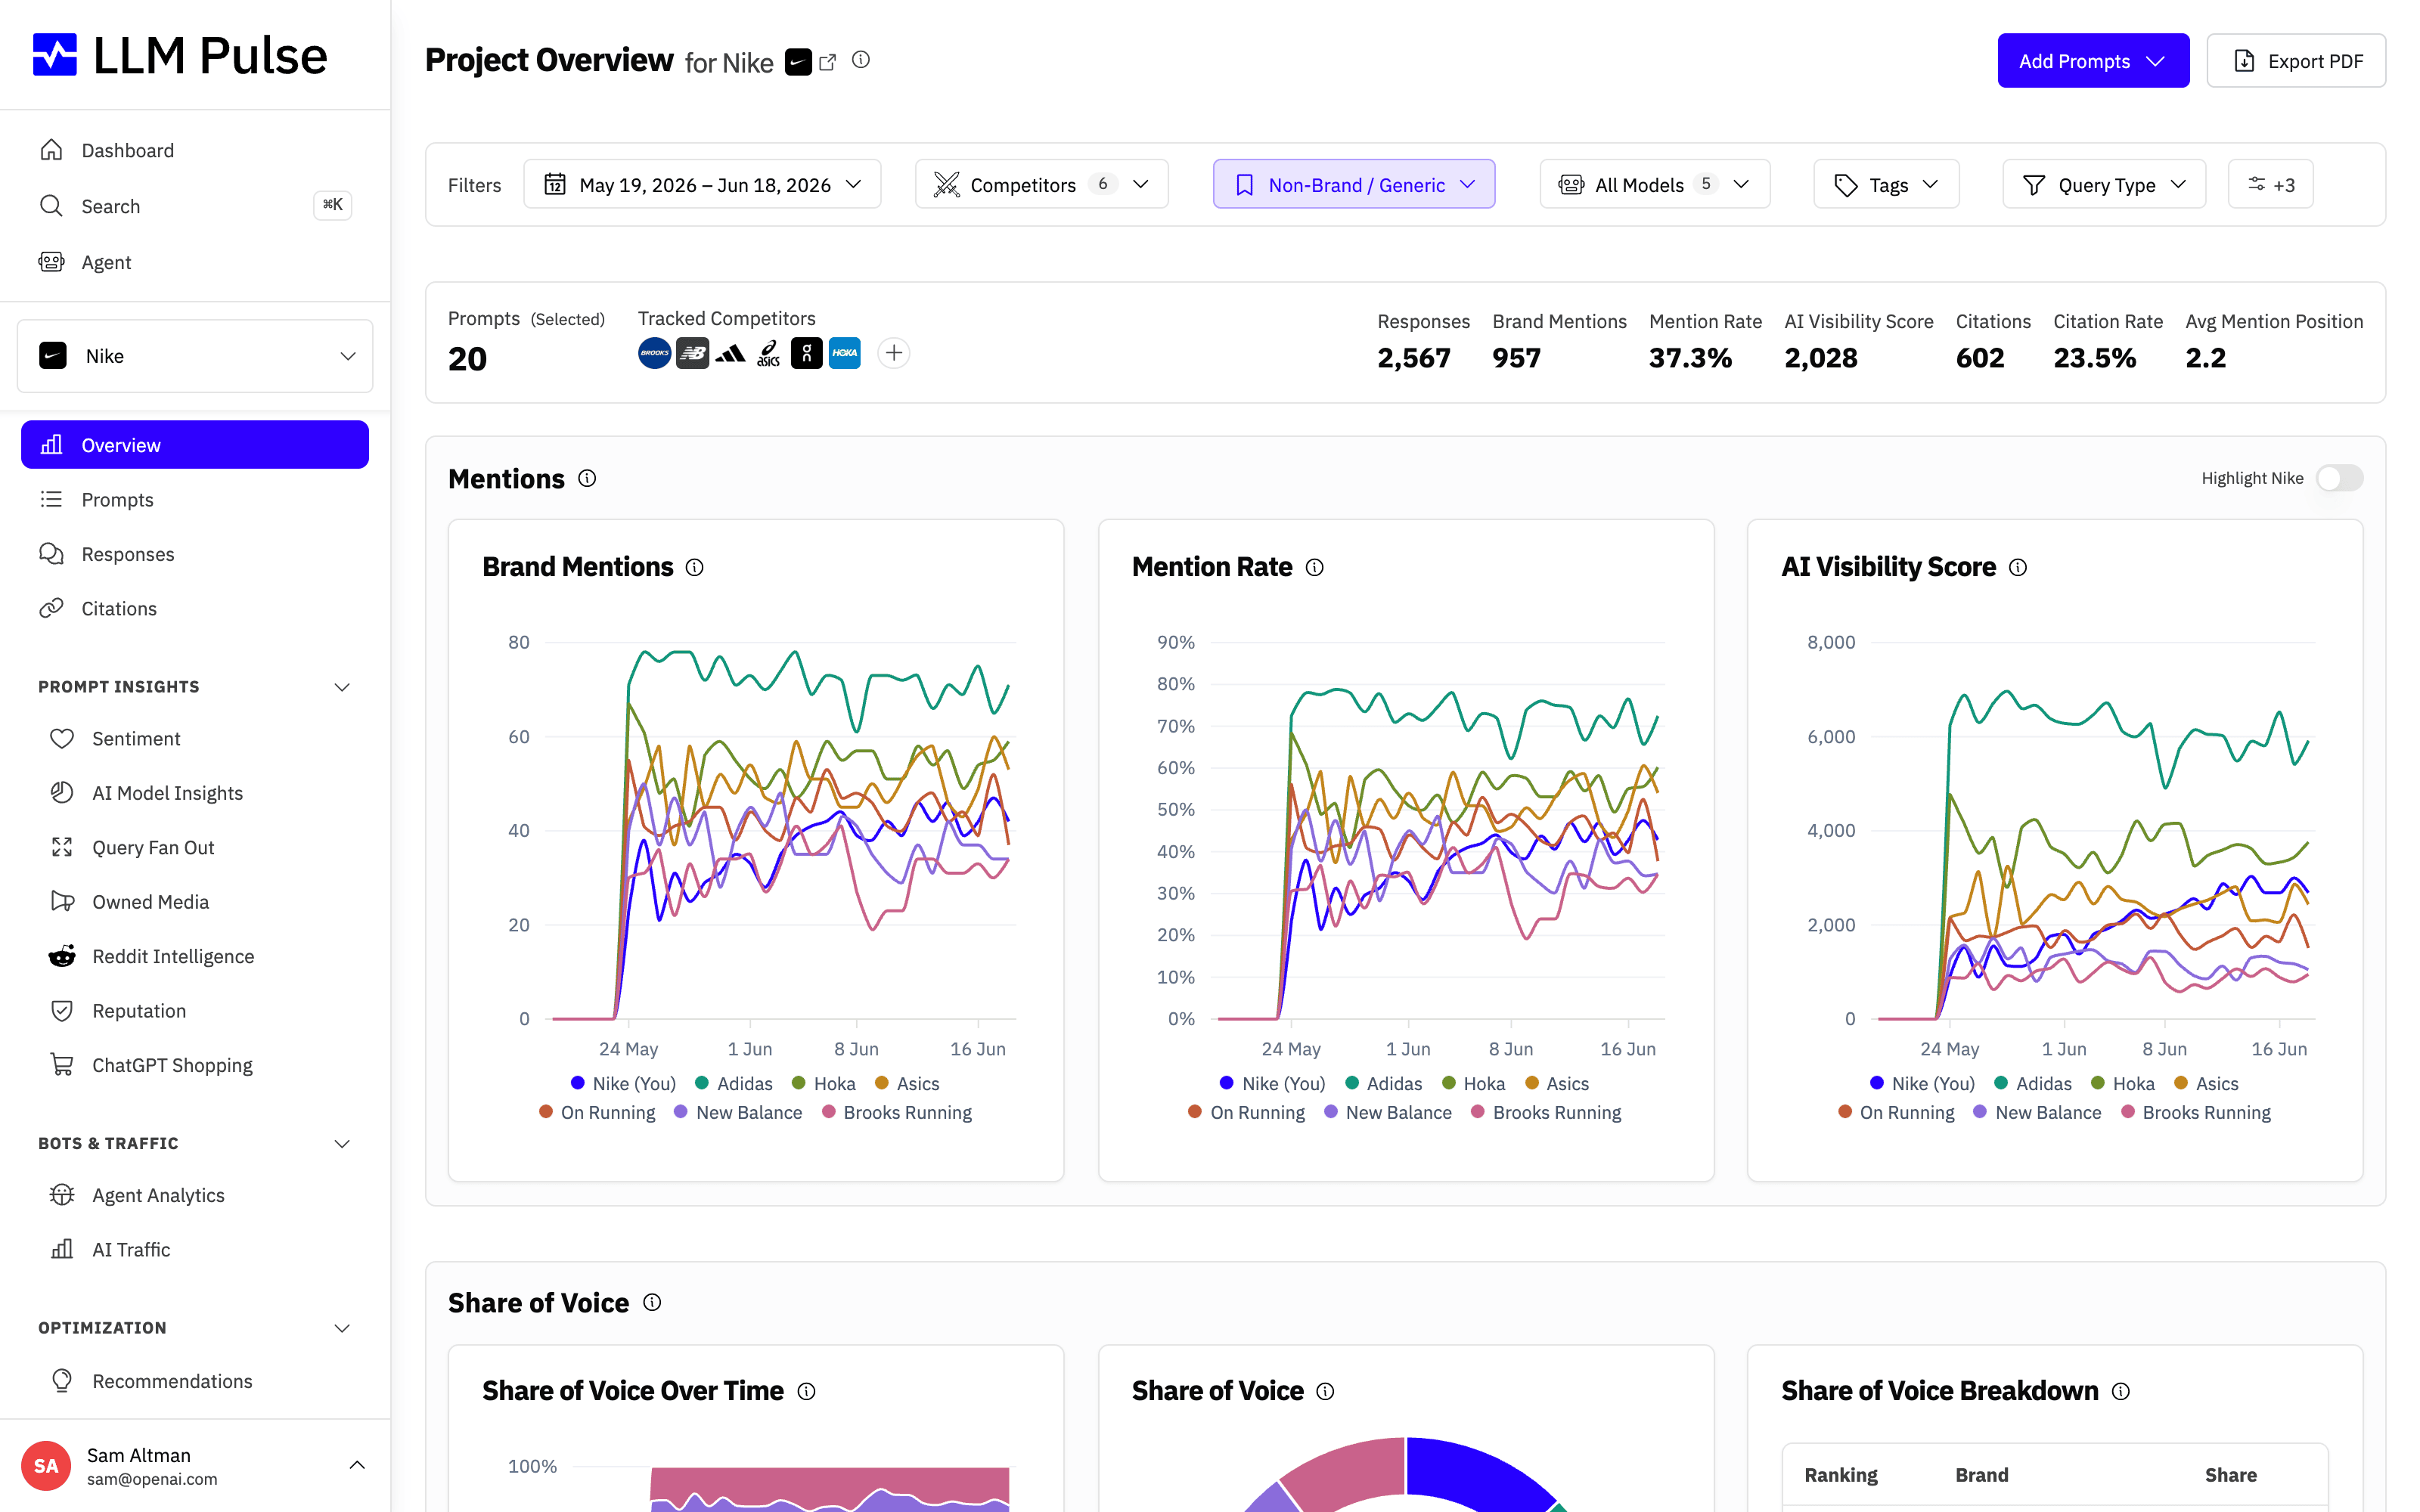
At the top you get a summary stats bar with your headline numbers, and below it the trend charts that plot those same metrics week by week so you can see where your AI visibility is heading.
What it does
- Brand Mentions chart: shows how many AI responses mention your brand over time
- Mention Rate chart: the percentage of tracked prompts where your brand was mentioned (previously called Brand Visibility)
- AI Visibility Score chart: a position-weighted metric where earlier mentions score higher (Position 1 = 100 points, Position 2 = 50, Position 3 = 33, etc.)
- Summary stats bar: total mentions, executions, Mention Rate, AI Visibility Score, Citations, Citation Rate, and Average Mention Position
- Competitor comparison: overlay competitor trends on the same charts
How to use it
- Select a project from the sidebar or Dashboard
- Use filters at the top: date range, AI model, tags, query type, brand focus, country, language
- Select competitors to compare using the competitor dropdown
- Hover over chart points for detailed tooltips with exact values
- Toggle between weekly aggregation views
- Use the Export PDF button in the page header to download a branded PDF report of the dashboard with your current filters applied (see Exporting Your Data)
Tips & notes
- The Brand Type filter defaults to Non-Brand / Generic: prompts that name your brand (or a competitor's) trivially favor that brand, so generic prompts give the fairest brand-vs-competitor picture. Switch it to All Prompts to include every prompt; this is also why Overview numbers can differ from pages that show all prompts. If your project has no non-brand prompts, the page shows All Prompts automatically. Your choice is remembered per project, so the Overview keeps the Brand Type you picked on later visits. The AI Model Insights Overview tab applies the same default and shares the remembered choice
- Filters show with a blue highlight whenever they are narrowing the data, and active filters move to the front of the filter bar so they are easy to spot. The Brand Type filter stays blue even in its default Non-Brand state, as a reminder that the numbers exclude brand-focused prompts
- Mention Rate and the older name Brand Visibility are the same metric (mentions divided by executions, times 100)
- AI Visibility Score rewards being mentioned first. If you're always mentioned at Position 3, your score will be lower than a competitor at Position 1
- Average Mention Position is the plain average of where your brand lands among all brands named in an answer (Position 1 means mentioned first). Lower is better, and it shows a dash when your brand has no positioned mentions in the selected range
- Citations and Citation Rate include visible links and background source references. Background citations do not affect citation position metrics because they have no visible rank
- Top Citations groups By Host when exact-subdomain matching is enabled. The View All link keeps the current filters and custom dates
- Charts use carry-forward for weeks with no data, so the line stays flat rather than dropping to zero
- Share of Voice shows your mention share vs top 4 competitors + "Others"