AI Model Comparisons: visibility across ChatGPT, Gemini & Perplexity
AI Model Comparisons (also called AI Model Insights) is a matrix view that compares brands and competitors across every AI model you track: ChatGPT, Perplexity, Gemini, Google AI Mode and Google AI Overviews. It helps you identify which models favor which brands and where your optimization efforts should focus.
With AI Model Comparisons, you can:
- See which AI models mention your brand most, and which ones ignore you
- Compare your Mention Rate, Citation Rate, sentiment, and position side by side against competitors, per model
- Find the specific model where a competitor out-ranks you, so you know where to concentrate GEO work
- Spot a model that cites your URLs but never names your brand, or vice versa
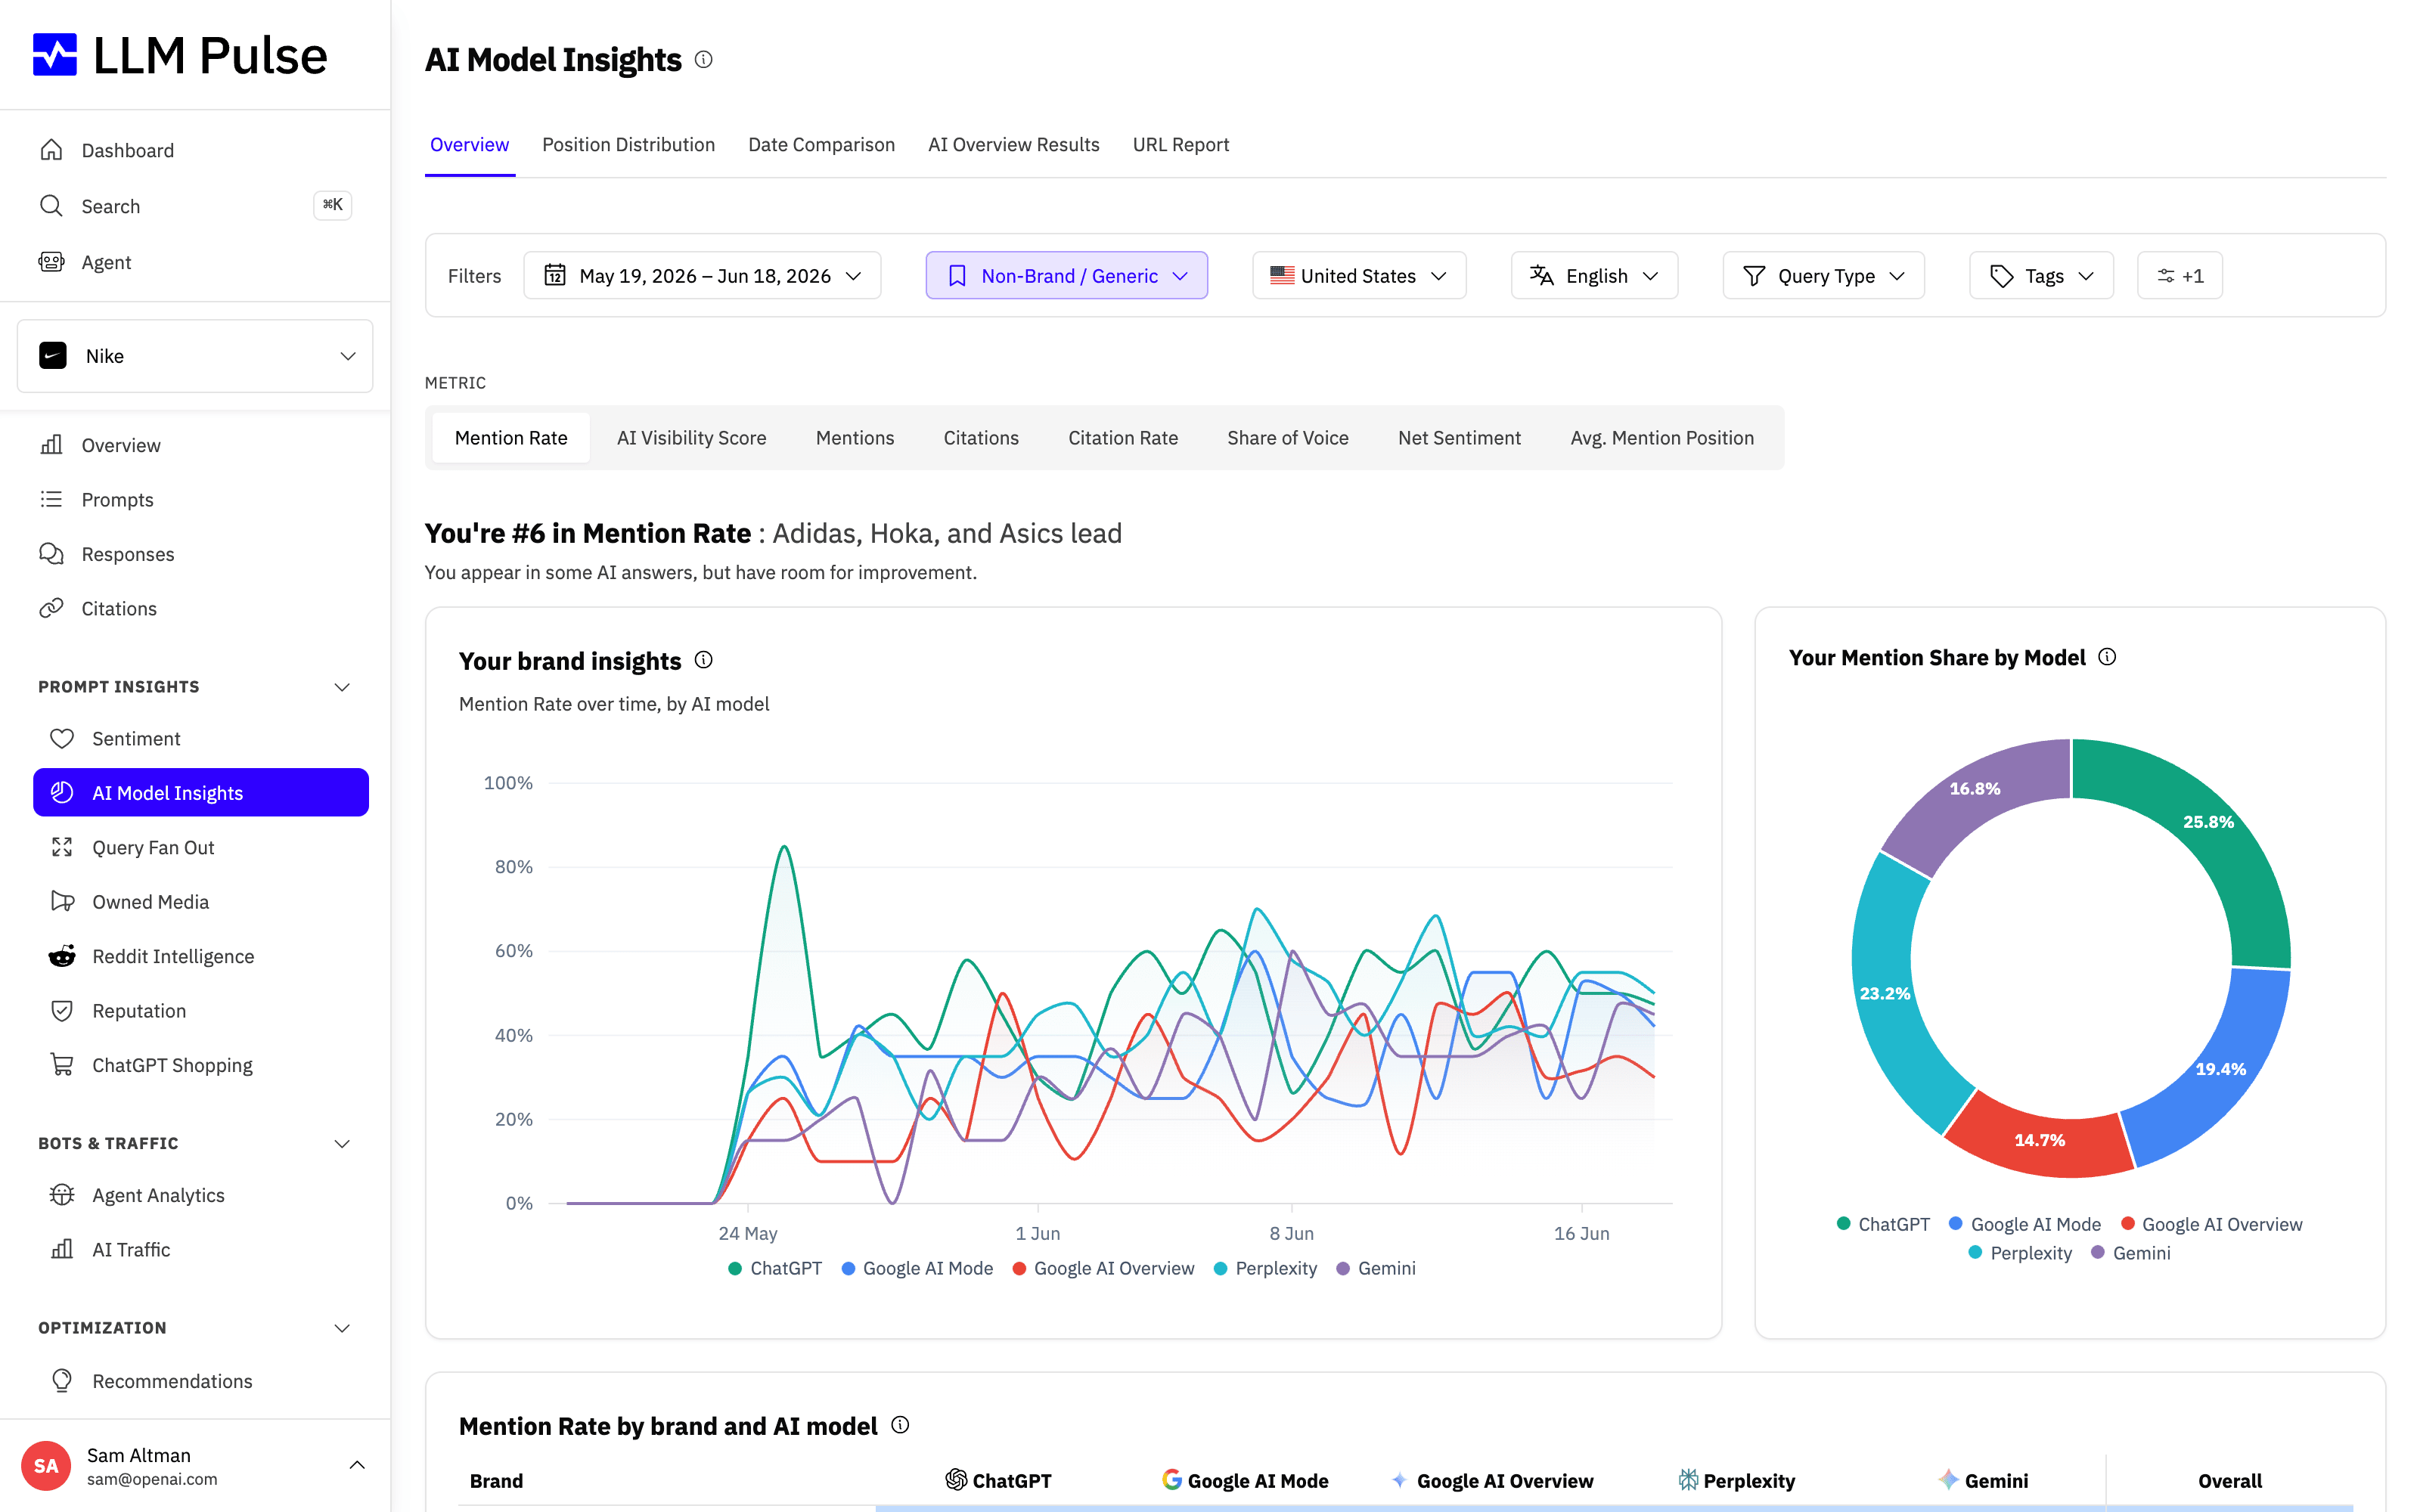
The report pairs a mention rate trend line with a mention share breakdown, so you can see both how each model's visibility moves over time and how that visibility is split between your brand and competitors.
What it does
- Displays a comparison table with brands as rows and AI models as columns
- Supports 8 analysis tabs, each showing a different metric perspective:
- Brand Visibility: mention rate per model
- Citation Rate: how often each model returns your URLs as visible or background sources
- Net Sentiment: sentiment scores per model
- AI Visibility Score: position-weighted visibility per model
- Average Mention Position: the average order your brand appears among all brands named in an answer (Position 1 means mentioned first, lower is better), per model and per competitor
- Position Distribution: how often you appear at Position 1, 2, or 3+ per model
- Date Comparison: compare two dates side by side to see metric changes
- AI Overview Results: performance specifically in Google AI Overviews
- Shows pie charts breaking down each brand's visibility by AI model
- Lets you compare two specific dates to track how rankings changed over time
How to use it
- Navigate to AI Model Insights in the sidebar (under Reports)
- Use the metric tabs at the top to switch between different comparison views
- Filter by date range, tags, country, or language
- In the Date Comparison tab, select two dates to see metric changes side by side
- The table highlights which models give you the strongest visibility
Tips & notes
- Different AI models may perceive your brand very differently, a strong position in ChatGPT doesn't guarantee the same in Gemini
- Use this to identify which models need optimization and which are already performing well
- The AI Overview Results tab is specific to Google AI Overviews and shows how your brand appears in that context
- Position Distribution shows the distribution of your mention positions (1st, 2nd, 3rd+), higher Position 1 rates indicate stronger brand authority in that model, and it now also shows the average mention position headline for your brand next to a competitor
- Average Mention Position is the single number behind Position Distribution: select it as a metric on the Overview tab to compare your average rank against competitors across every model, and it also appears in the Overview dashboard KPI bar. Lower is better