Understand your AI visibility dashboard
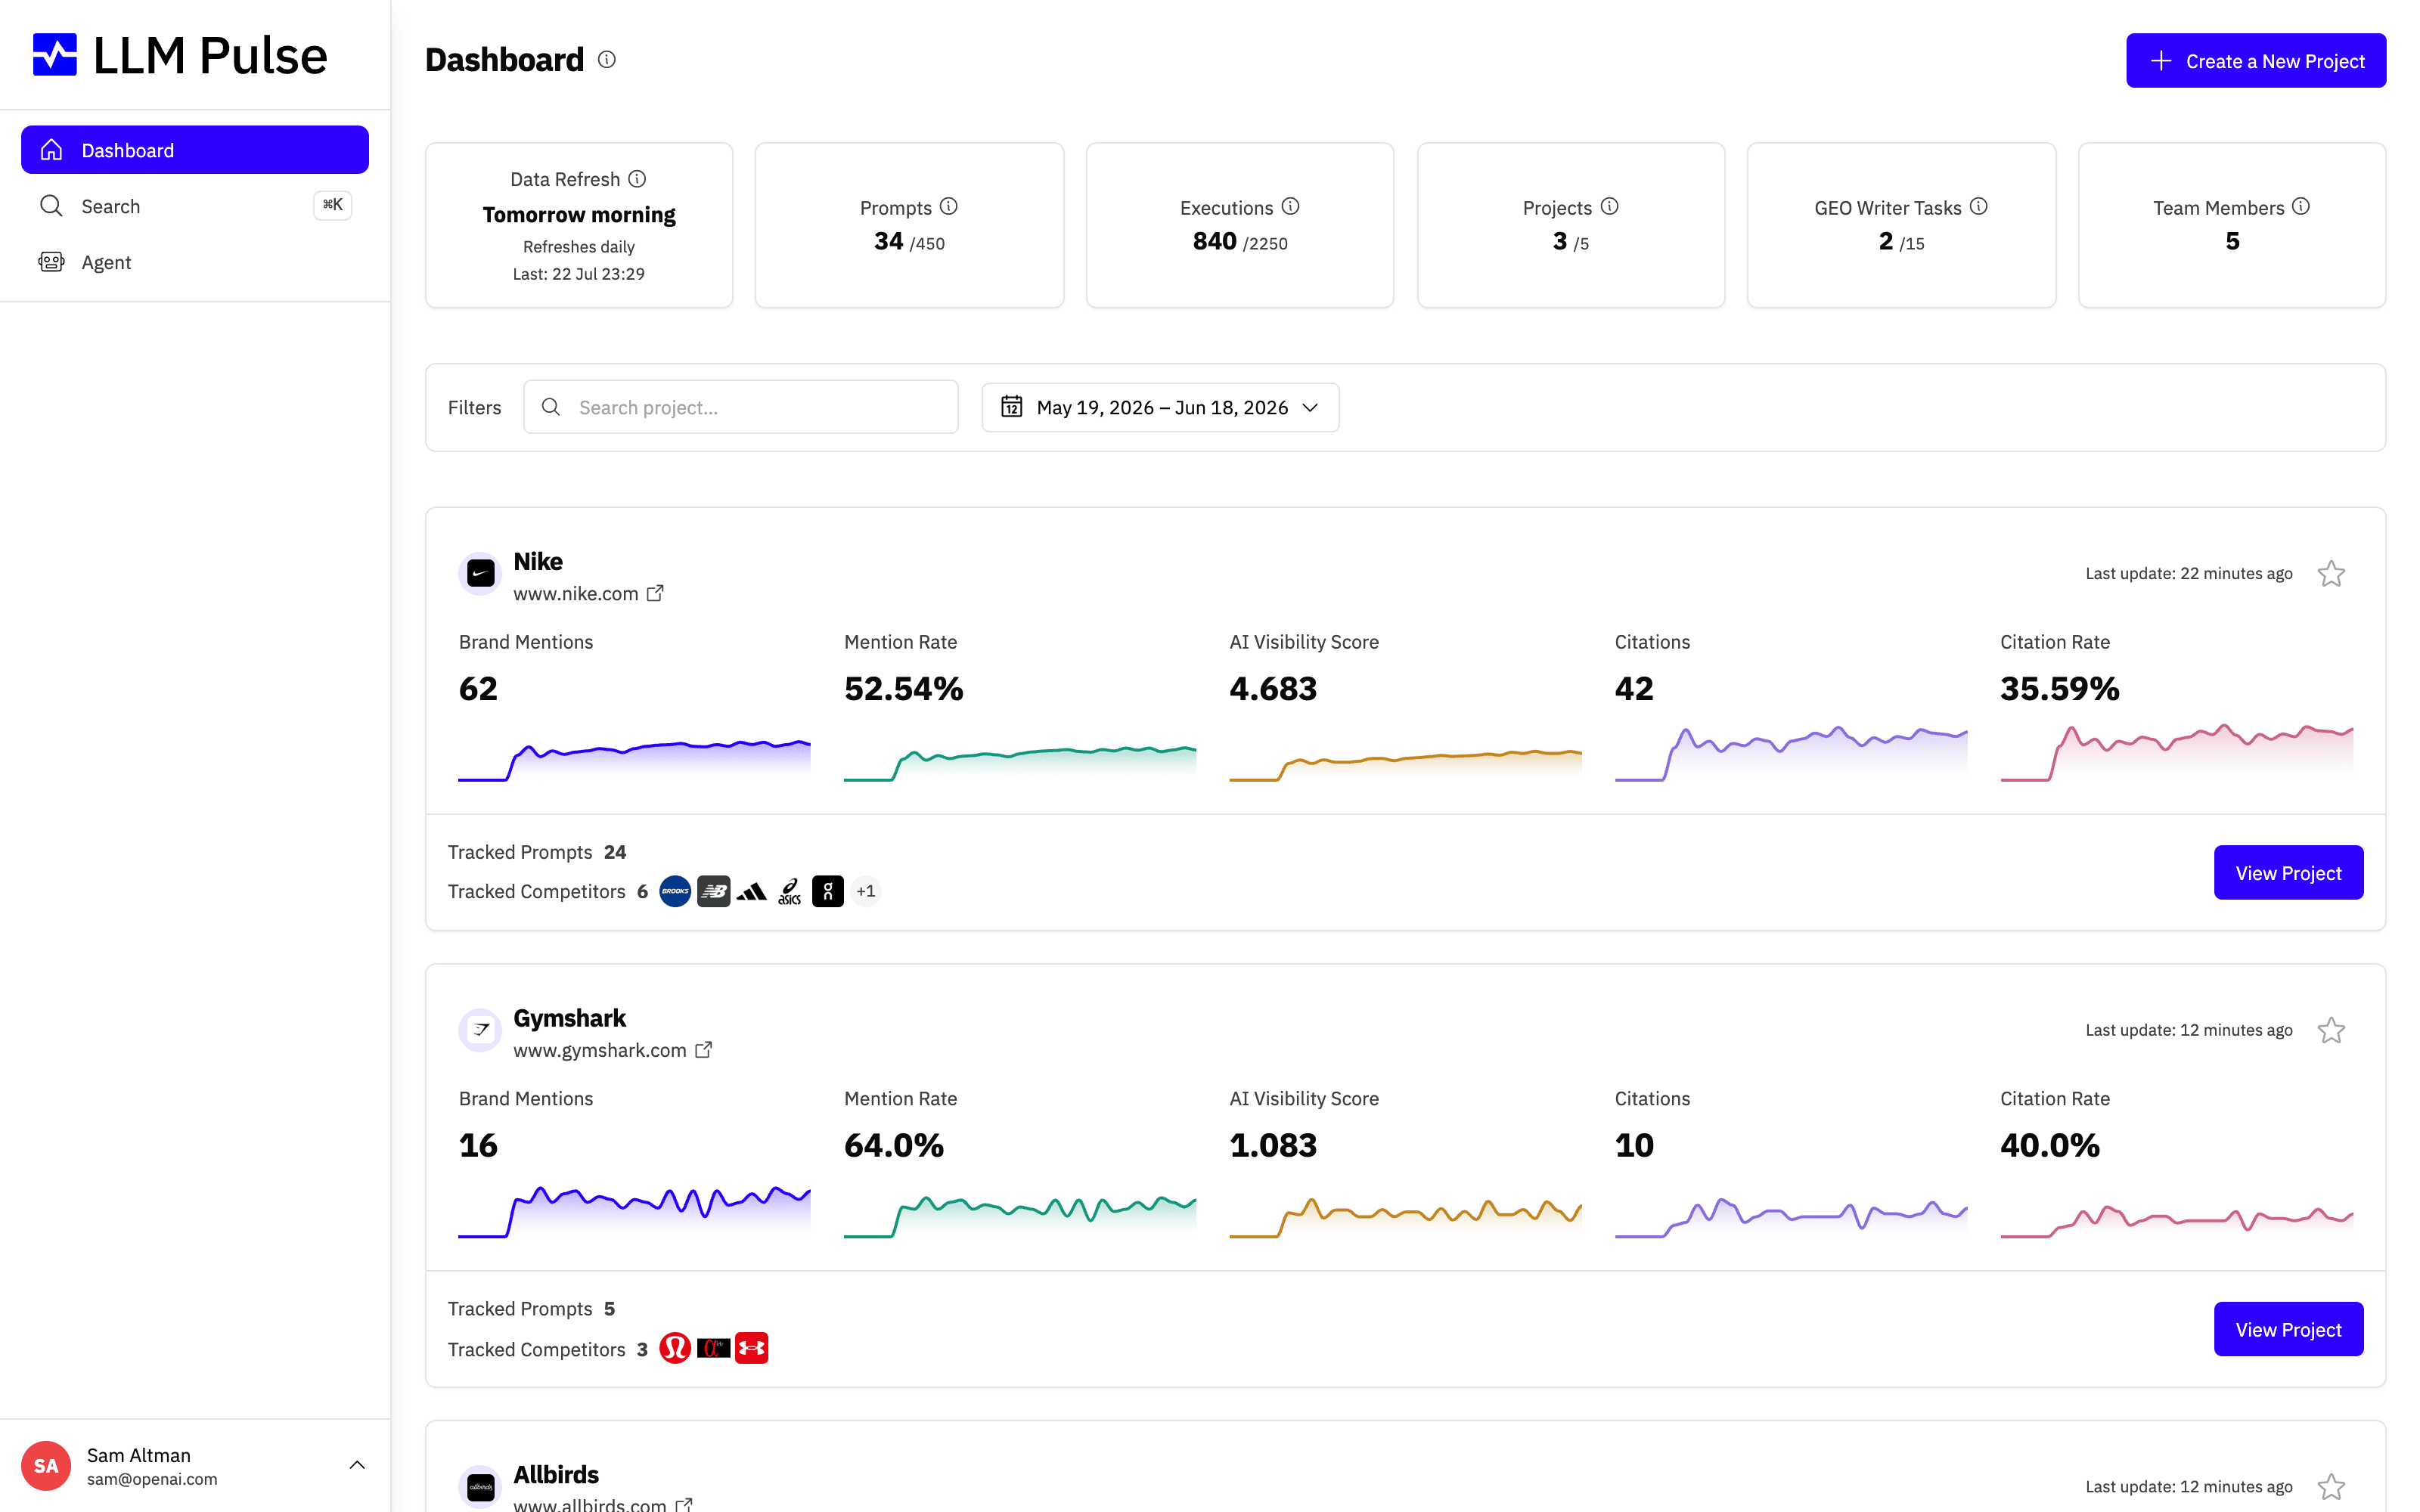
The Dashboard is your home base in LLM Pulse. It shows a summary of all your projects with key metrics at a glance, plus account-wide stats like prompt usage and execution counts.
At the top you get a row of usage stat cards, and below them one project card per brand you track, each with its headline metrics and trend sparklines.
What it does
- Displays stat cards at the top: Data Refresh timing, Prompts used/limit, Executions used/limit, Projects count, Intelligence Tasks, Team Members
- Shows a project card for each project with: Brand Mentions, Mention Rate, AI Visibility Score, Citations, Citation Rate, each with trend sparklines
- Supports date range filtering and project search to find specific projects quickly
- Provides comparison mode showing metric changes vs the previous period
How to use it
- The Dashboard loads automatically when you sign in
- Use the date range selector to adjust the analysis period (Last 7 days, 30 days, 90 days, or custom)
- Click on any project card to dive into that project's detailed Overview
- Use the search bar to filter projects by name
- Click Create a New Project at the bottom to add another project
- Star projects to pin them to the top using the favorite icon
Opening a project Overview
Clicking a project card takes you into that project's Overview, the detailed analytics view for a single brand. If the project is new, a getting-started setup checklist appears at the top to guide you through the first steps so your data starts flowing.
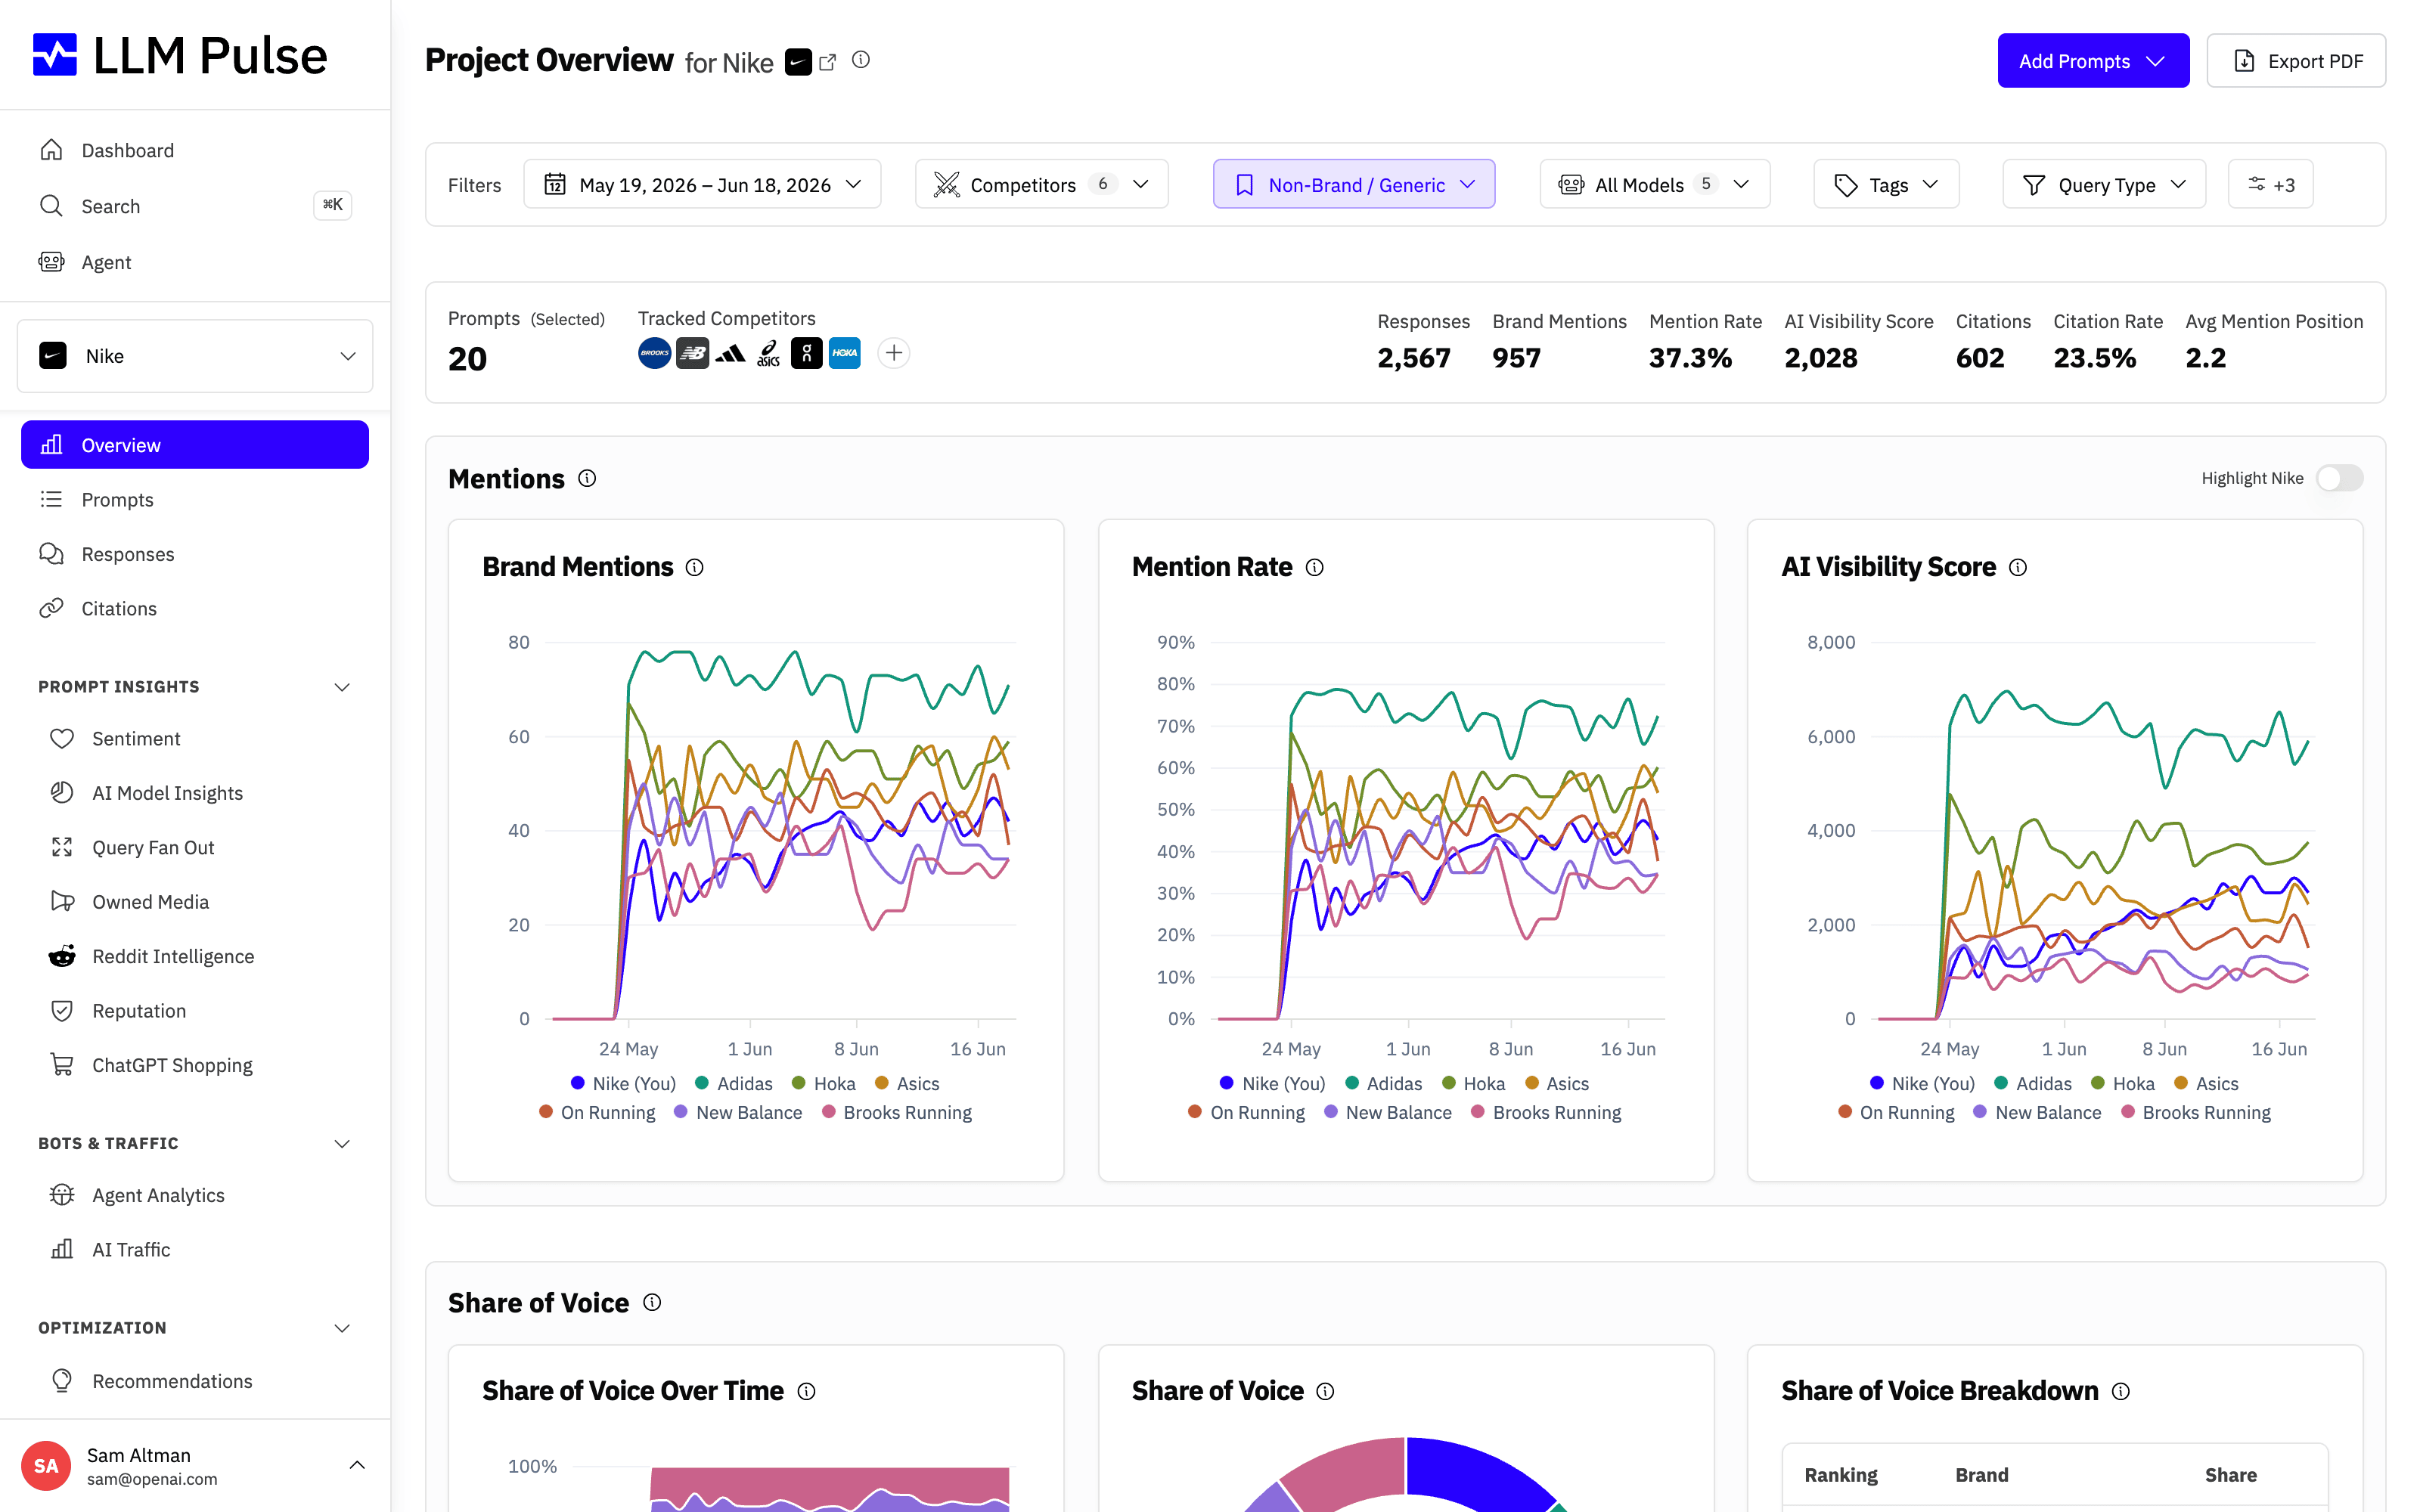
Work through the checklist items to finish setup, then return to the Dashboard at any time to compare progress across all your projects.
Tips & notes
- The "Data Refresh" card shows when the next prompt execution cycle will run
- Execution counts show
used / limit. If you hit the limit, new prompts wait for the next billing period - The Dashboard shows data for ALL your projects. To see details for one project, click its card
- Project cards show mini sparkline charts for the last 7 data points of each metric