Entiende tu panel de visibilidad en IA
El Dashboard es tu base de operaciones en LLM Pulse. Muestra un resumen de todos tus proyectos con las métricas clave de un vistazo, además de estadísticas a nivel de cuenta como el uso de prompts y el número de ejecuciones.
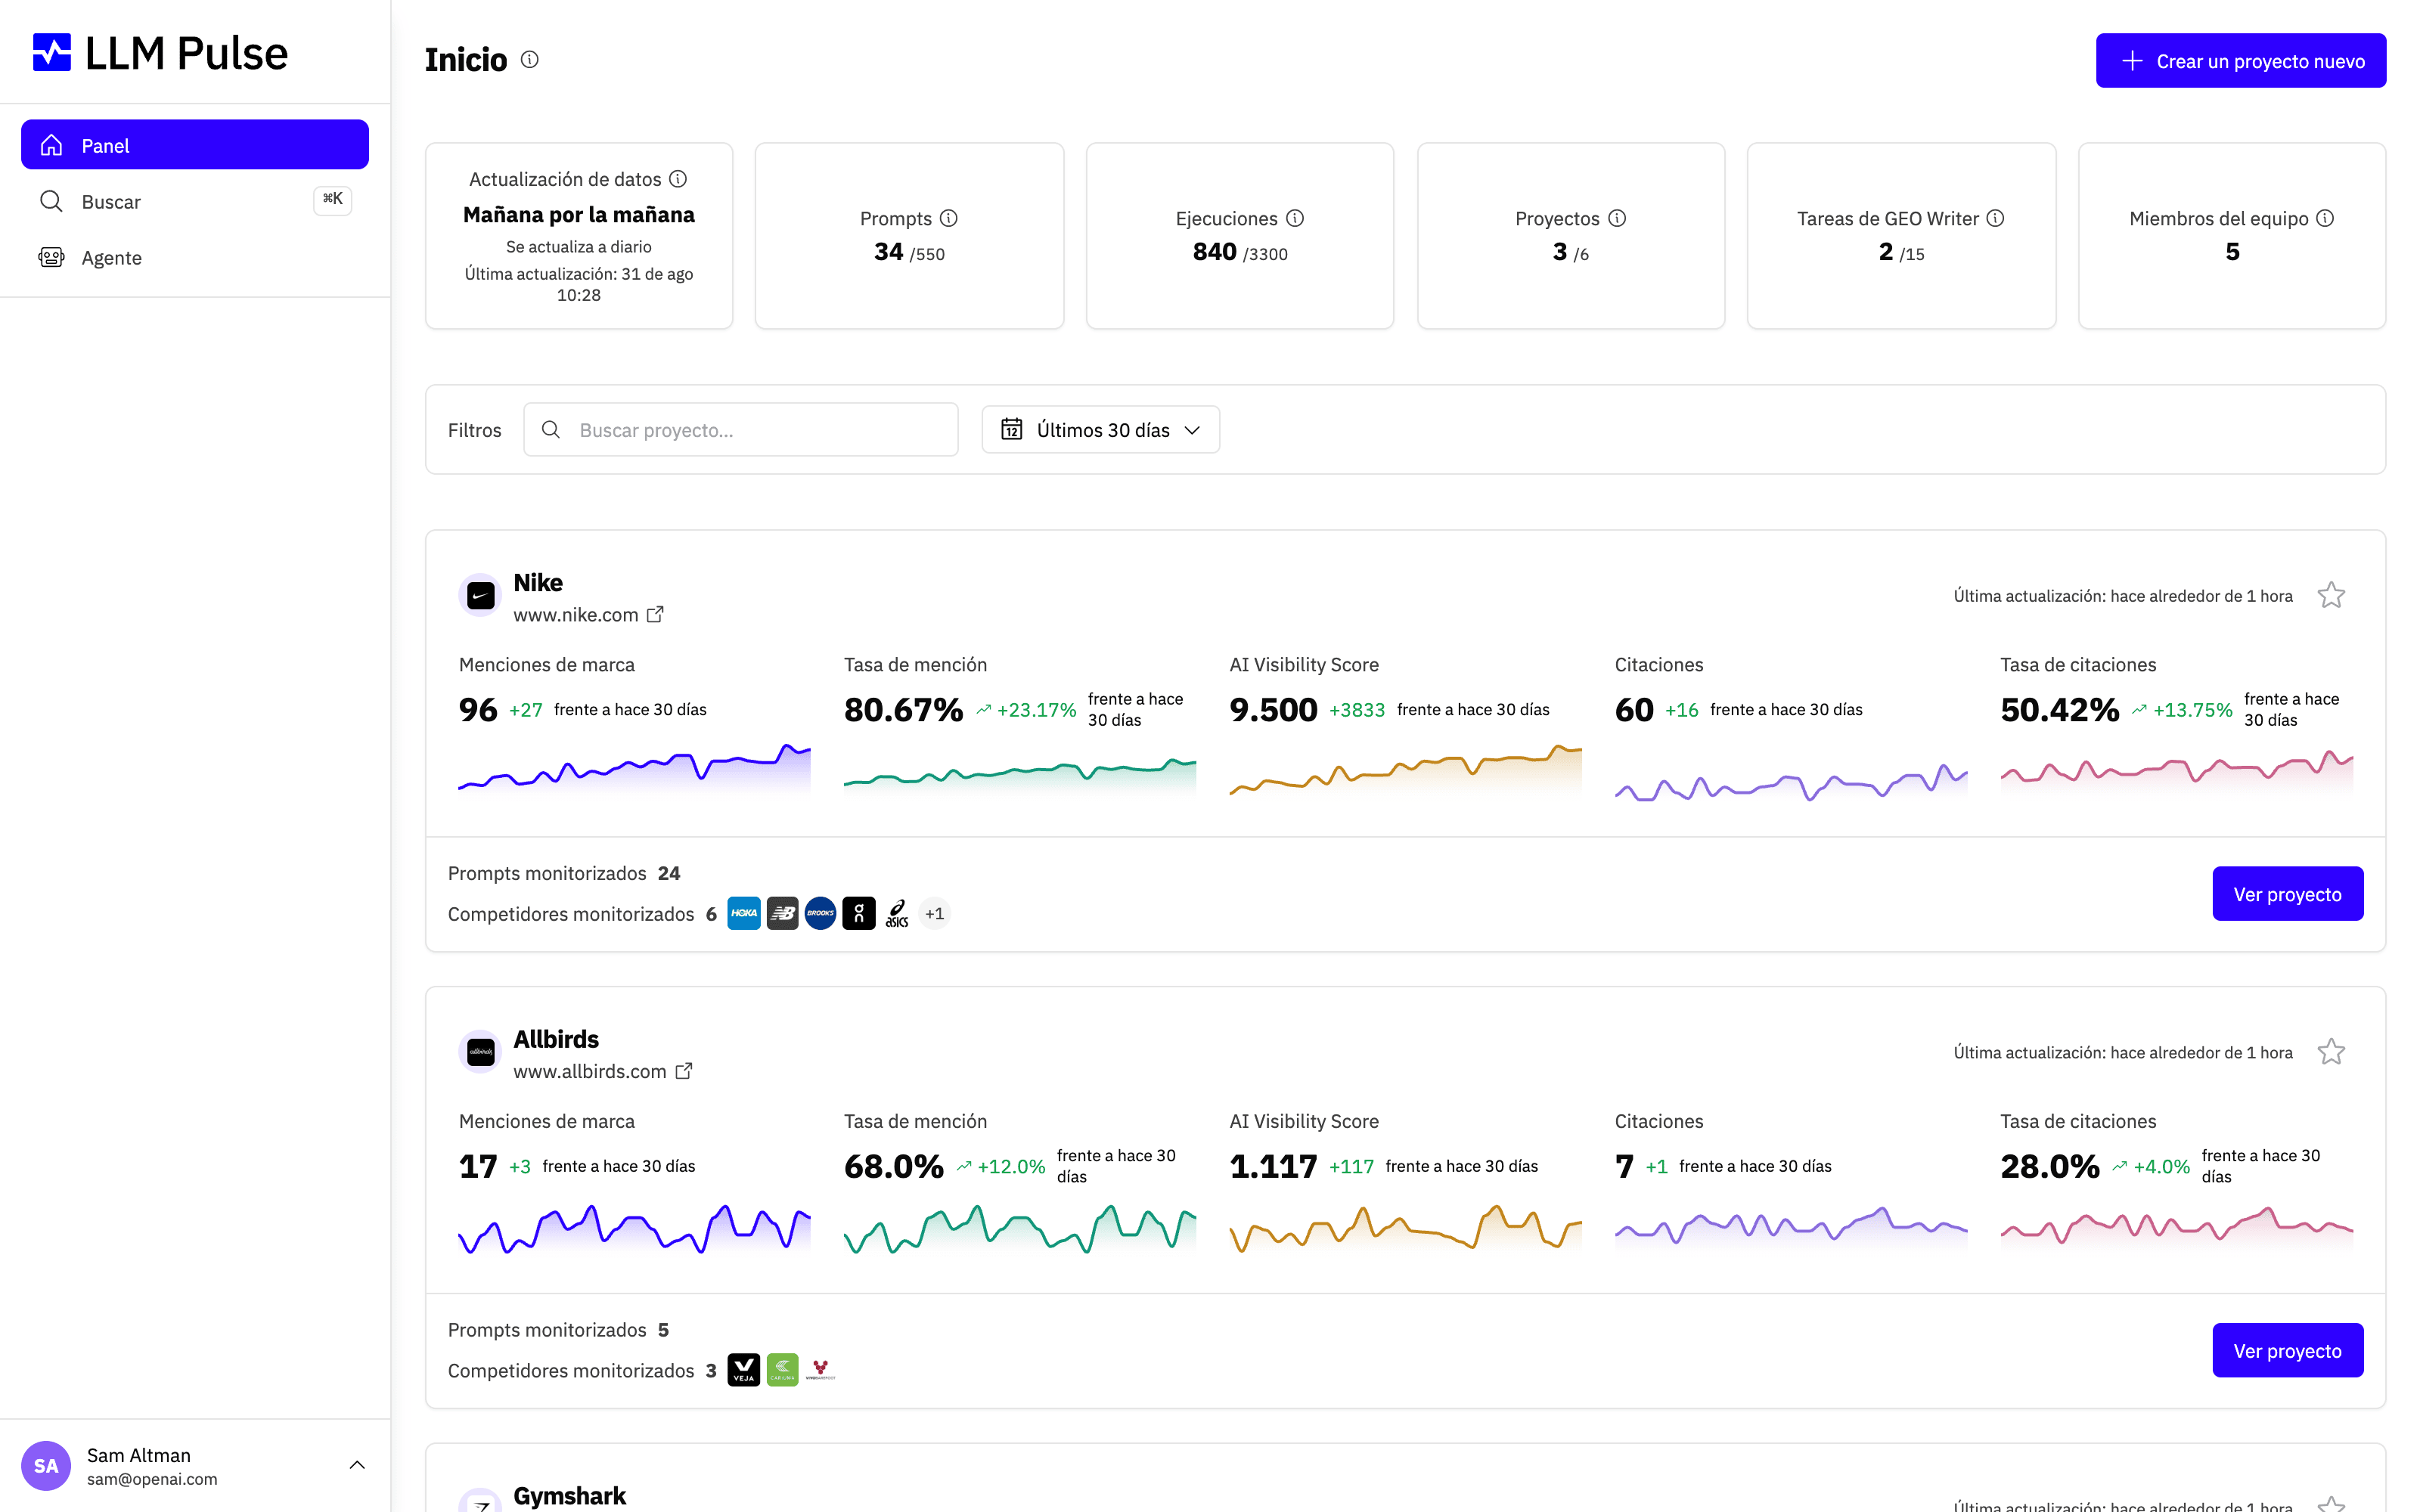
En la parte superior encontrarás una fila de tarjetas de estadísticas de uso y, debajo, una tarjeta de proyecto por cada marca de la que haces seguimiento, cada una con sus métricas principales y minigráficos de tendencia.
Qué hace
- Muestra tarjetas de estadísticas en la parte superior: Data Refresh (momento de actualización de datos), Prompts usados/límite, Ejecuciones usadas/límite, número de proyectos, Tareas de Inteligencia y miembros del equipo
- Muestra una tarjeta de proyecto por cada proyecto con: menciones de la marca, tasa de menciones, AI Visibility Score, citaciones y tasa de citaciones, cada una con su minigráfico de tendencia
- Permite filtrar por rango de fechas y buscar proyectos para localizar rápidamente cualquier proyecto
- Incluye un modo de comparación que muestra los cambios de las métricas en comparación con el periodo anterior
Cómo utilizarlo
- El Dashboard se carga automáticamente al iniciar sesión
- Usa el selector de rango de fechas para ajustar el periodo de análisis (últimos 7 días, 30 días, 90 días o uno personalizado)
- Haz clic en cualquier tarjeta de proyecto para acceder a la vista general (Overview) detallada de ese proyecto
- Usa la barra de búsqueda para filtrar proyectos por nombre
- Haz clic en Crear un nuevo proyecto en la parte inferior para añadir otro proyecto
- Fija proyectos arriba marcándolos con una estrella mediante el icono de favorito
Abrir la vista general (Overview) de un proyecto
Al hacer clic en una tarjeta de proyecto accederás a la vista general (Overview) de ese proyecto, la vista de análisis detallada de una sola marca. Si el proyecto es nuevo, verás en la parte superior una lista de comprobación de configuración inicial que te guiará por los primeros pasos para que tus datos empiecen a llegar.
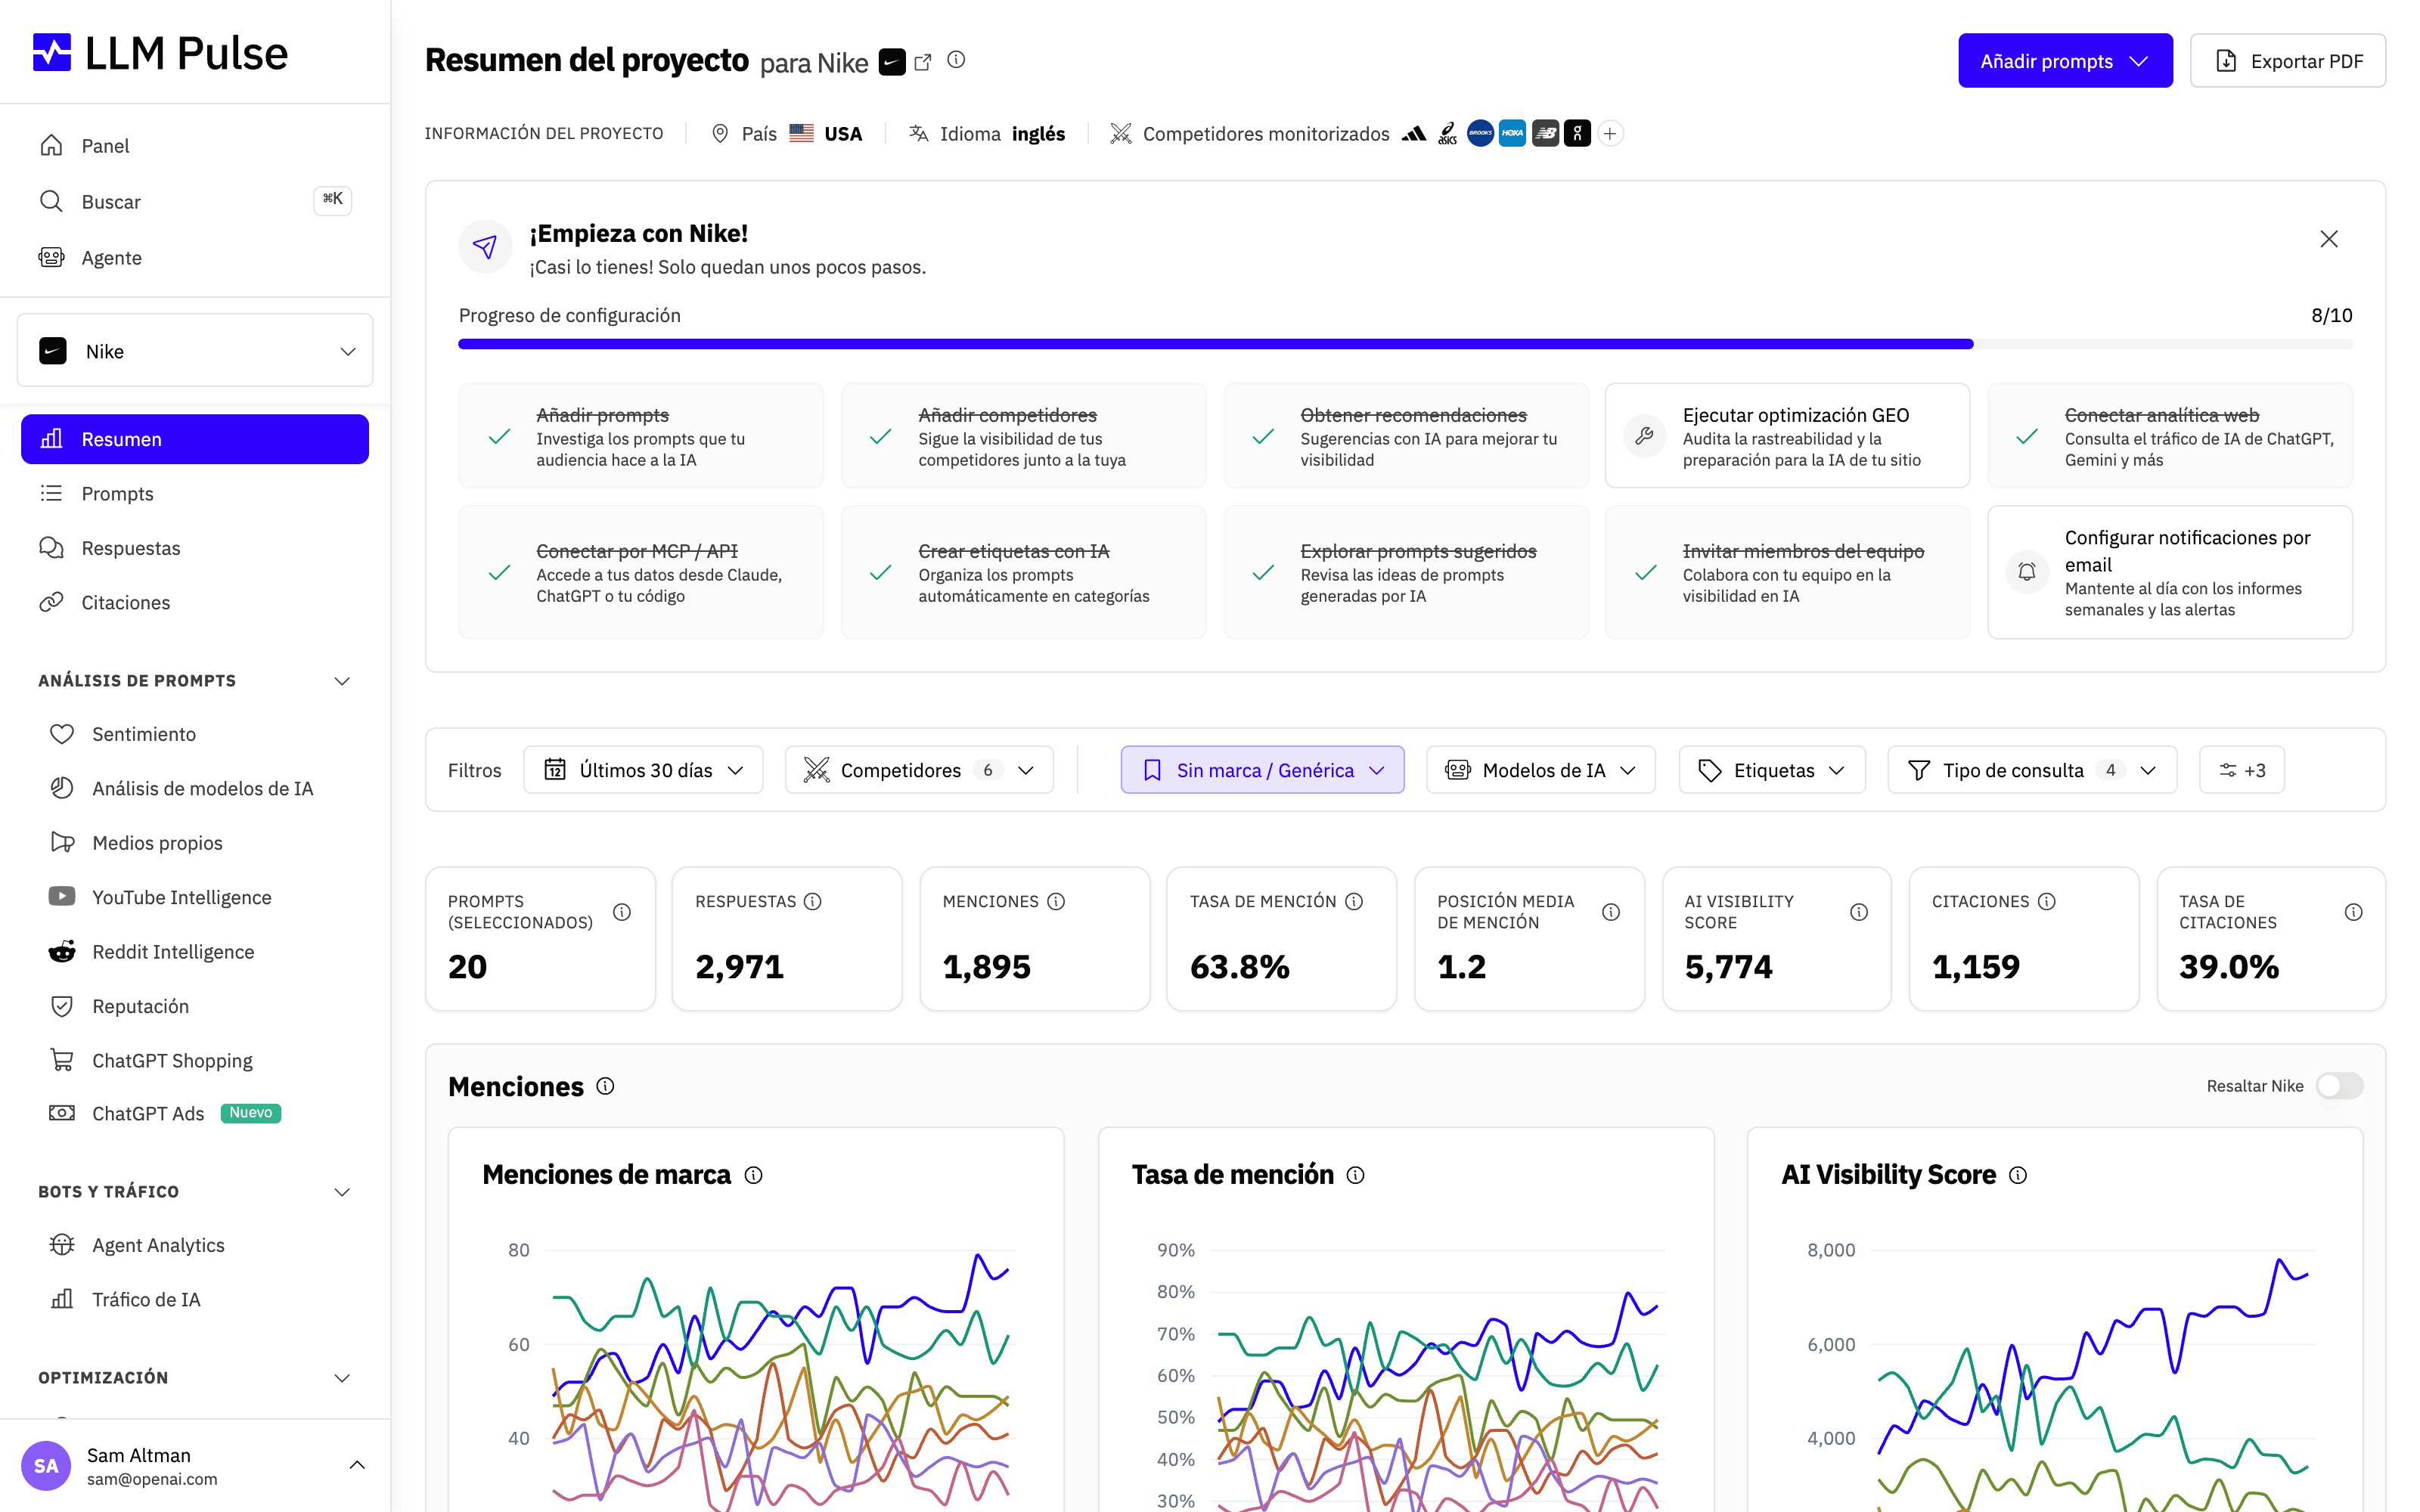
Completa los elementos de la lista de comprobación para terminar la configuración y, en cualquier momento, vuelve al Dashboard para comparar el progreso de todos tus proyectos.
Consejos y notas
- La tarjeta "Data Refresh" muestra cuándo se ejecutará el próximo ciclo de ejecución de prompts
- Los contadores de ejecución muestran
used / limit. Si alcanzas el límite, los nuevos prompts esperarán al siguiente periodo de facturación - El Dashboard muestra los datos de TODOS tus proyectos. Para ver los detalles de un proyecto, haz clic en su tarjeta
- Las tarjetas de proyecto muestran minigráficos con los últimos 7 puntos de datos de cada métrica