



Last updated: October 14, 2026
You already track your AI visibility in LLM Pulse. Now you can package it up and share it. Custom Reports are a new way to turn your data into a clean, branded report that lives at its own public URL, ready to send to a client, an exec, or the rest of your team.
Table of Contents
What are Custom Reports?
Custom Reports let you build a fully tailored AI visibility report and share it with anyone through a single public URL, no login required. Perfect for keeping clients, execs, or your wider team in the loop.
Here’s what you can do:
- Make it yours. Pick your date range, filter by AI model, add tags, and choose exactly which competitors to compare against.
- Drag-and-drop layout. Tick the sections you want and reorder them however you like.
- Add your own touch. Drop in headings, text, dividers, and images to brand the report and tell the story your way.
- Track the trend. Compare your summary KPIs against the previous period to see what’s moving.
- Share it anywhere. Every published report gets a public link, and you can schedule it to go out by email each week automatically.
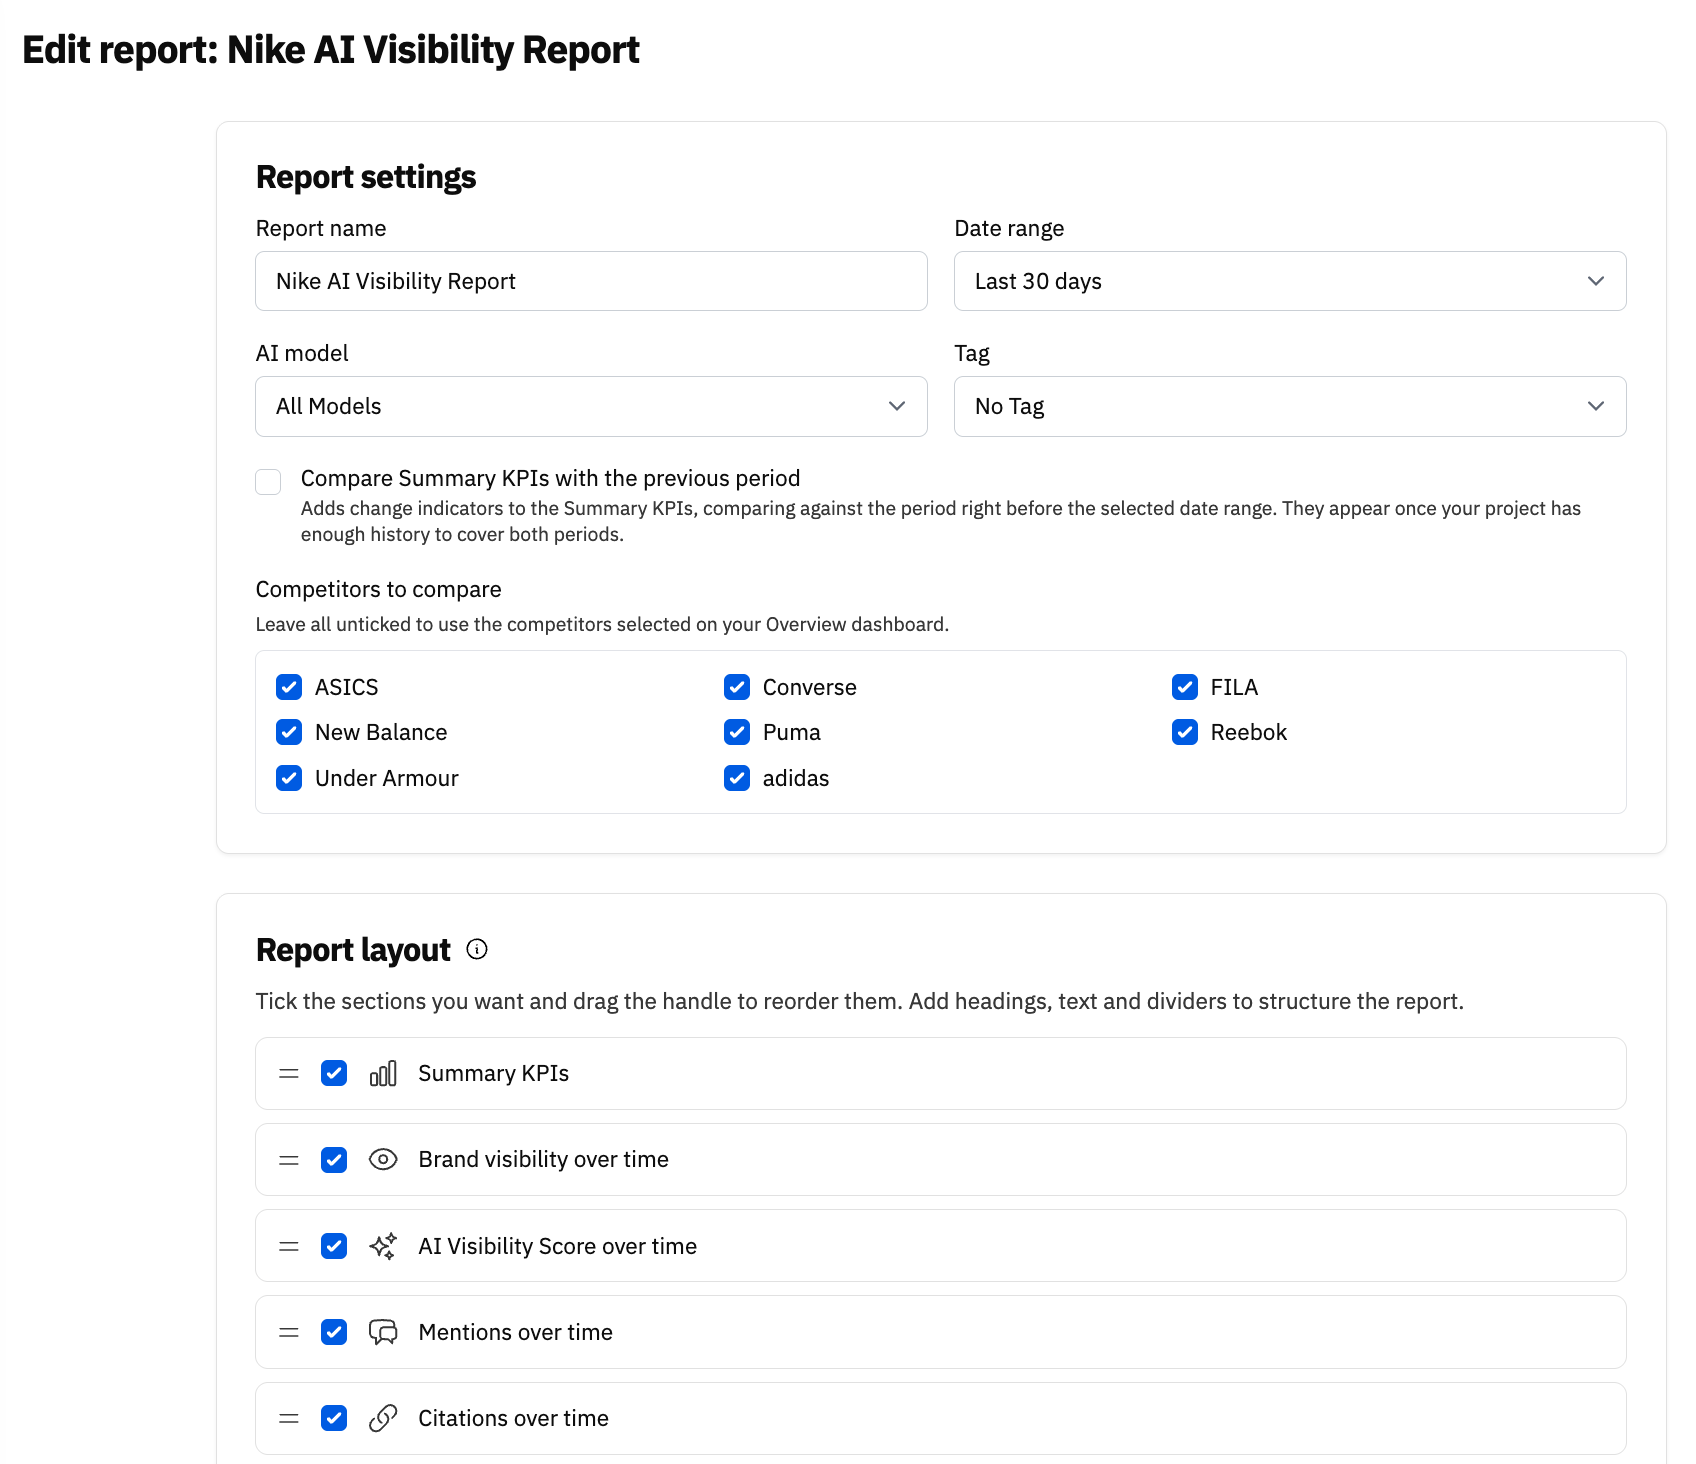
Set it up exactly how you want, from the date range and models to the competitors you compare against and the sections you include:
What you can include in a custom report
Tick the sections you want and drag them into the order that tells your story:
| Section | What it answers |
|---|---|
| Summary KPIs | Your headline AI visibility numbers at a glance, with optional change vs the previous period. |
| Brand visibility over time | How often AI engines surface your brand across tracked prompts. |
| AI Visibility Score | Your overall visibility score and how it is trending. |
| Share of Voice | Your slice of the conversation versus each competitor. |
| Mentions and Citations | Where you are mentioned and which sources AI engines cite for your topics. |
| Sentiment | How positively or negatively AI engines describe you. |
| Breakdowns by AI model | Where you win or lose visibility and citations per model. |
| Top cited domains and subreddits | The sources shaping the answers about your category. |
| Latest prompts | The real queries you are being tracked on. |
How to create and share a Custom Report
- In your project sidebar, go to Utilities > Custom Reports and click New report.
- Give it a name, then pick your date range, AI model, and any tags you want to include.
- Choose the competitors to compare against, or leave them all unticked to use your Overview defaults.
- In Report layout, tick the sections you want and drag them into the order that tells your story. Add headings, text, dividers, and images to brand it.
- Optional: turn on Compare KPI sections with the previous period to highlight what is moving.
- Hit Save, then Publish report under Share and schedule. Your report gets a public URL you can share with anyone, no login required.
- Optional: schedule it to go out by email each week automatically.
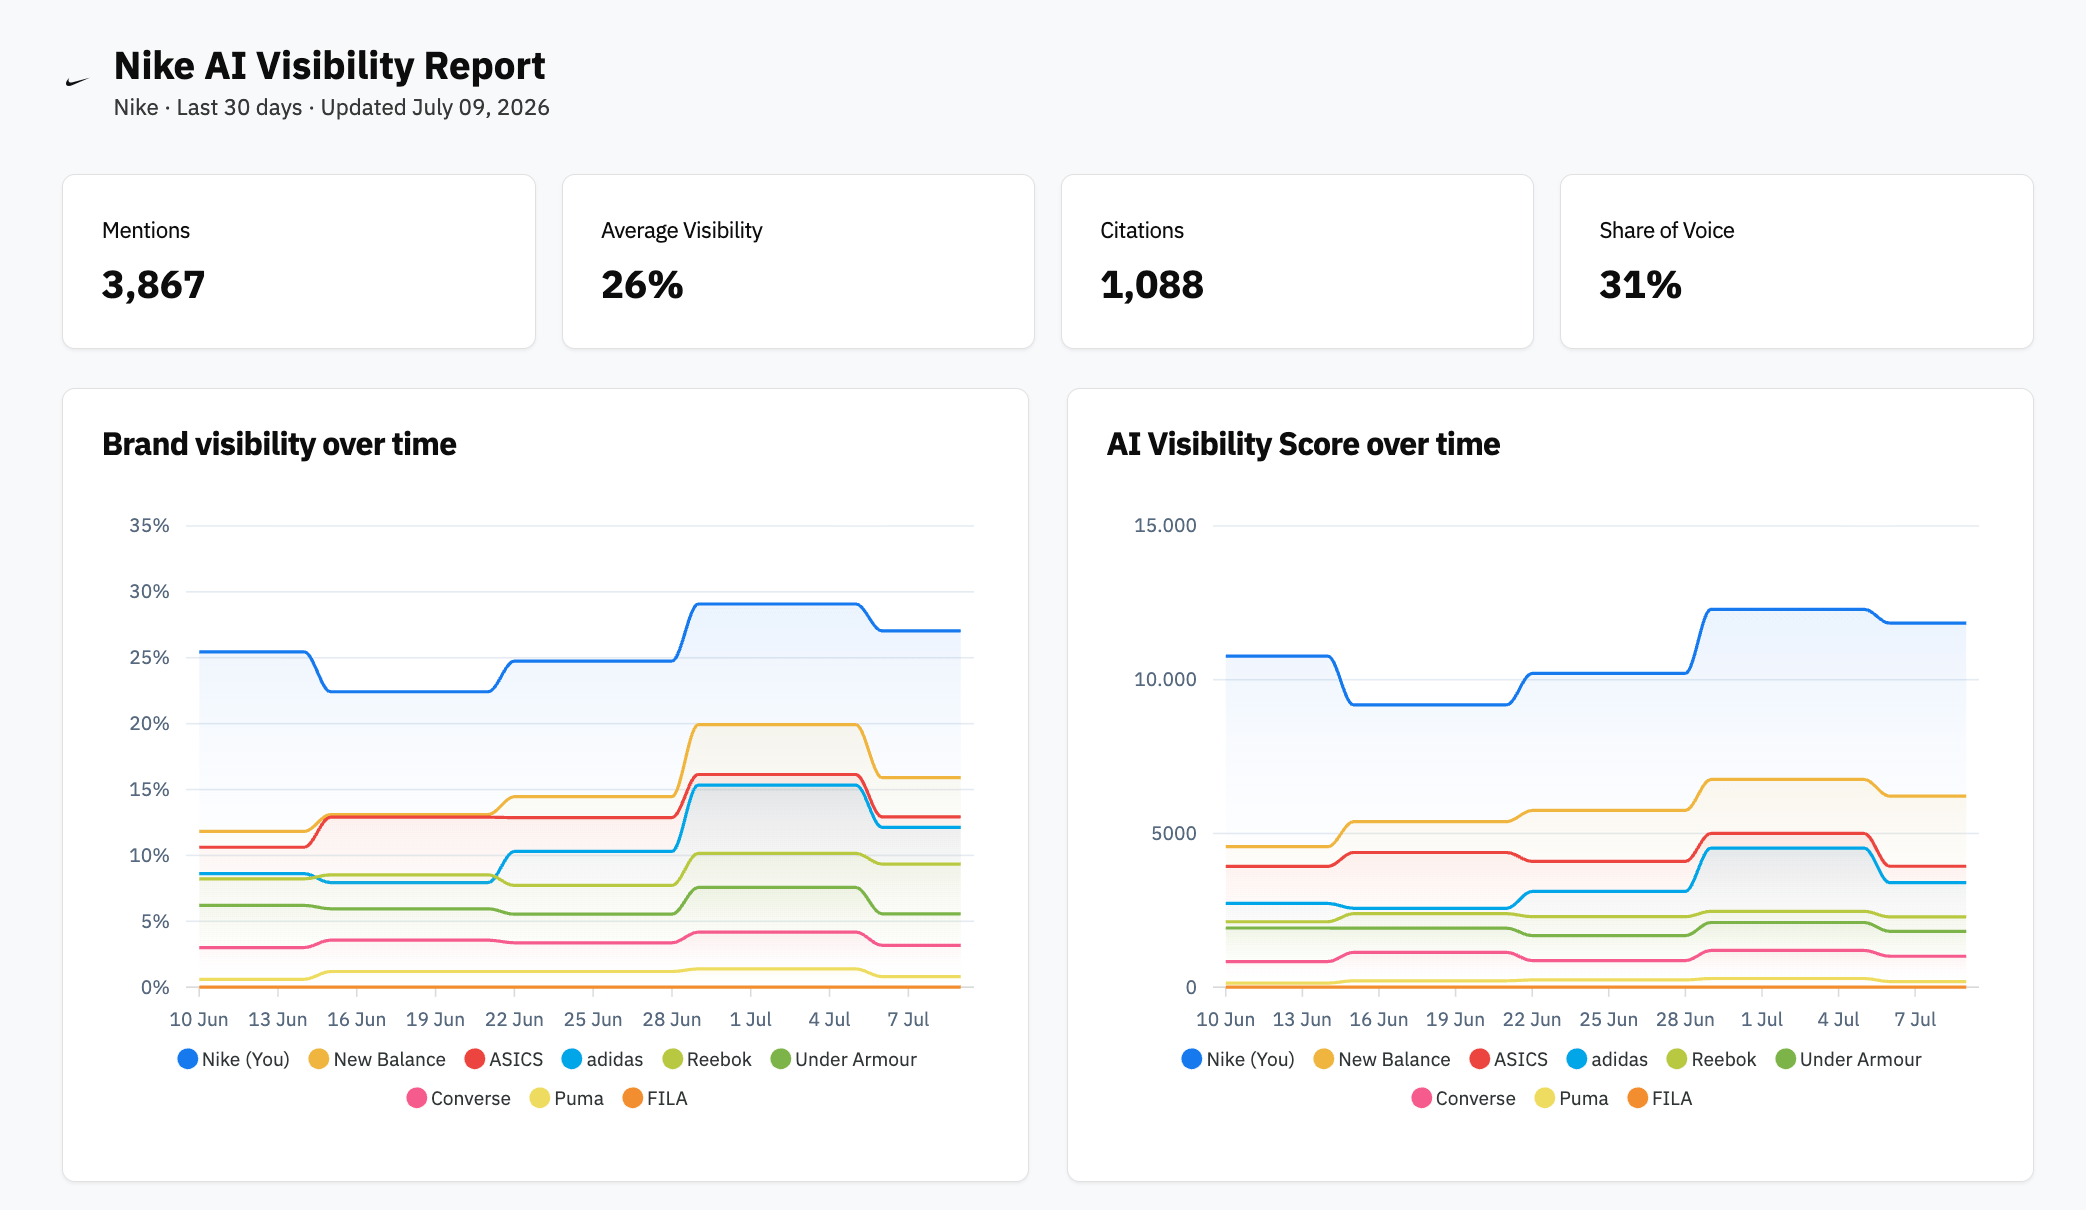
Here’s a finished, shareable report in action:
Try it on your own brand
Custom Reports are available. Choose an LLM Pulse plan and build your first shareable report. You’ll find it under Utilities > Custom Reports.
Want to see one first? We built a live Custom Report you can open right now:
FAQ
Do people need an LLM Pulse account to view a shared report?
No. Every published Custom Report gets a public URL that anyone with the link can open, with no login required, unless you add a password. It is ideal for sending to clients, execs or teammates who do not use the platform themselves.
Which sections can I include in a report?
You can pick from Summary KPIs, brand visibility, AI Visibility Score, mentions, citations, average position, share of voice, sentiment, breakdowns by AI model, top cited domains, top subreddits and latest prompts. Tick the ones you want and drag them into any order.
Can I compare against specific competitors? Y
es. Choose exactly which competitors to include on each report, or leave them unticked to use the competitor set from your Overview dashboard. That way each report can be tailored to a specific client or market.
Can I brand the report?
Yes. Add your own headings, text, dividers and images, such as a logo or banner, so the report matches your brand or your client’s. It reads as a polished deliverable rather than a raw dashboard export.
Can I send reports automatically?
Yes. Each report can be scheduled to go out by email every week, so your stakeholders always get a fresh view without you having to remember to send it.